

Question: B. Graphical Visualization of Correlation Consider the 6 scatterplots below. (15 points) Decide which graphs exhibit negative correlation that's weak, moderate and strong in
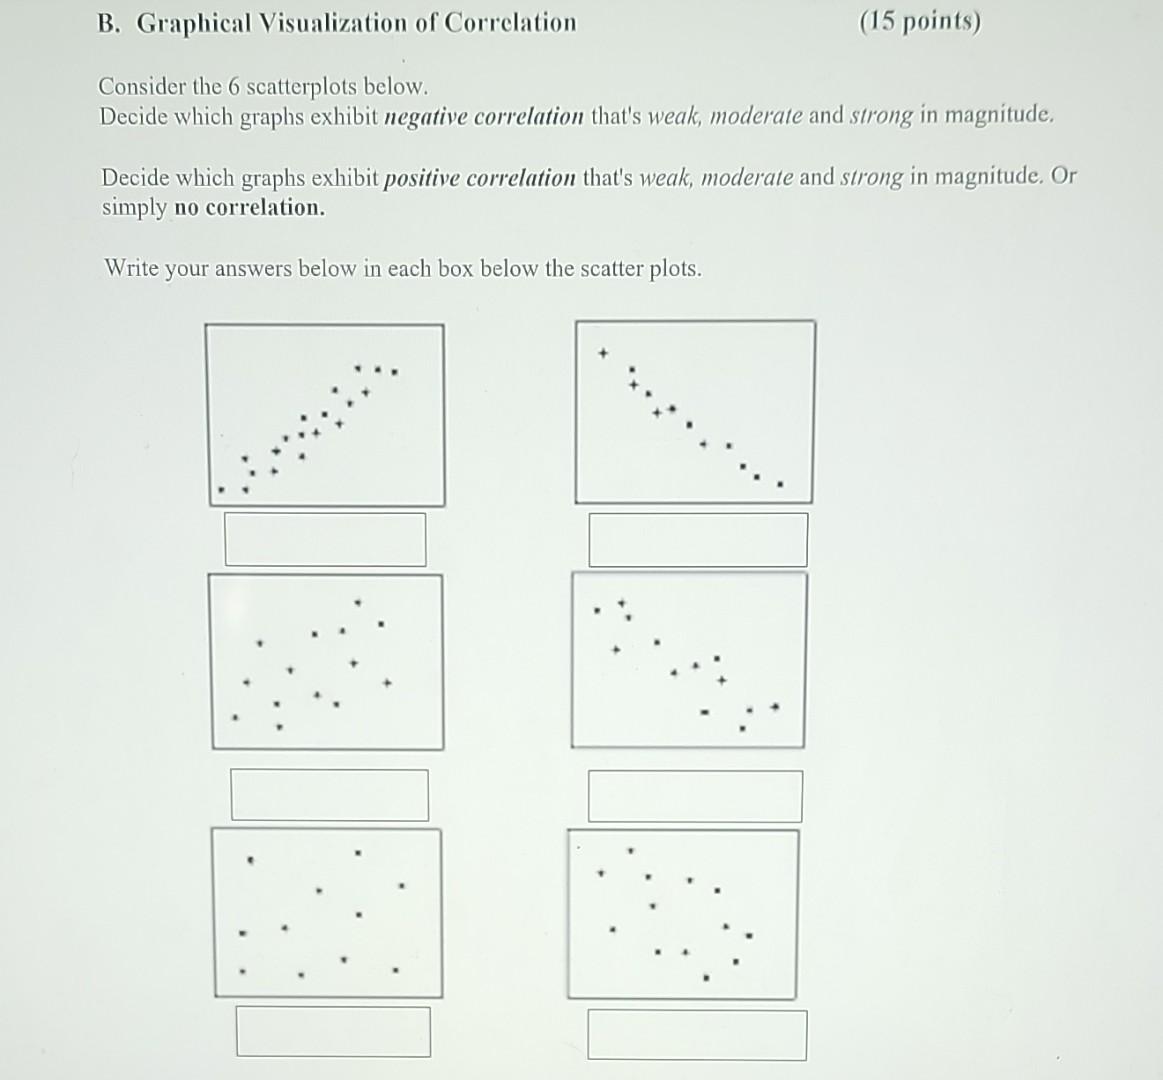
B. Graphical Visualization of Correlation Consider the 6 scatterplots below. (15 points) Decide which graphs exhibit negative correlation that's weak, moderate and strong in magnitude. Decide which graphs exhibit positive correlation that's weak, moderate and strong in magnitude. Or simply no correlation. Write your answers below in each box below the scatter plots.
Step by Step Solution
There are 3 Steps involved in it
1 Expert Approved Answer
Step: 1 Unlock

Question Has Been Solved by an Expert!
Get step-by-step solutions from verified subject matter experts
Step: 2 Unlock
Step: 3 Unlock