

Question: b) include UCL and LCL c) what are the control limits for the range chart? - based on the 10 samples, average range R =
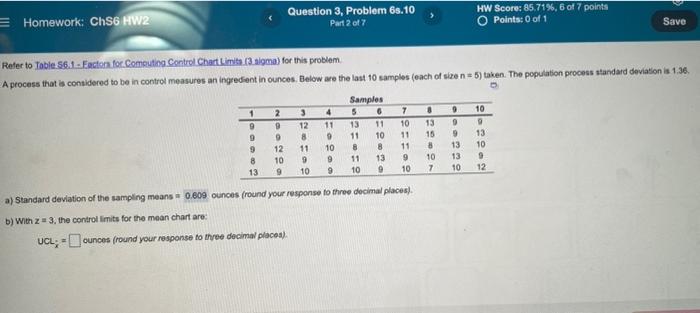
b) include UCL and LCL
c) what are the control limits for the range chart?
- based on the 10 samples, average range R = ?
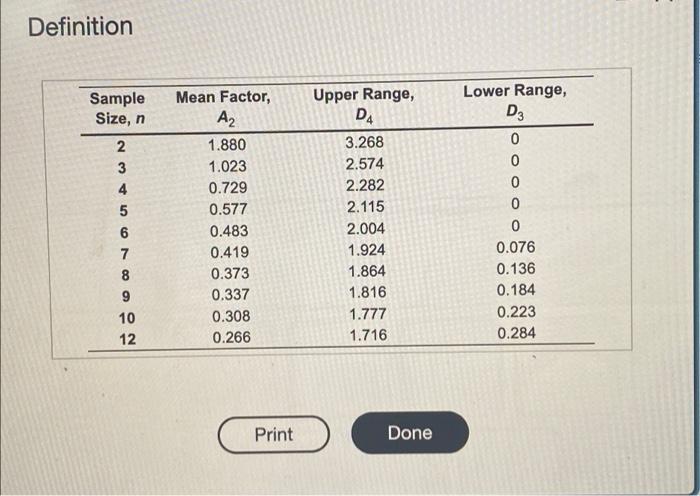
- UCL (D4)
-LCL (D4)
- UCL R
- LCL R
4) Based on the x bar chart is one or more damples beyond the control limits?
- Based on the R chart, is one or more samples beyond the control limits?
Step by Step Solution
There are 3 Steps involved in it
1 Expert Approved Answer
Step: 1 Unlock

Question Has Been Solved by an Expert!
Get step-by-step solutions from verified subject matter experts
Step: 2 Unlock
Step: 3 Unlock