

Question: (b) Interpret the results. Select all that apply. |:| A. The average hurricane is approximately category 2. |:| B. The average hurricane is approximately category
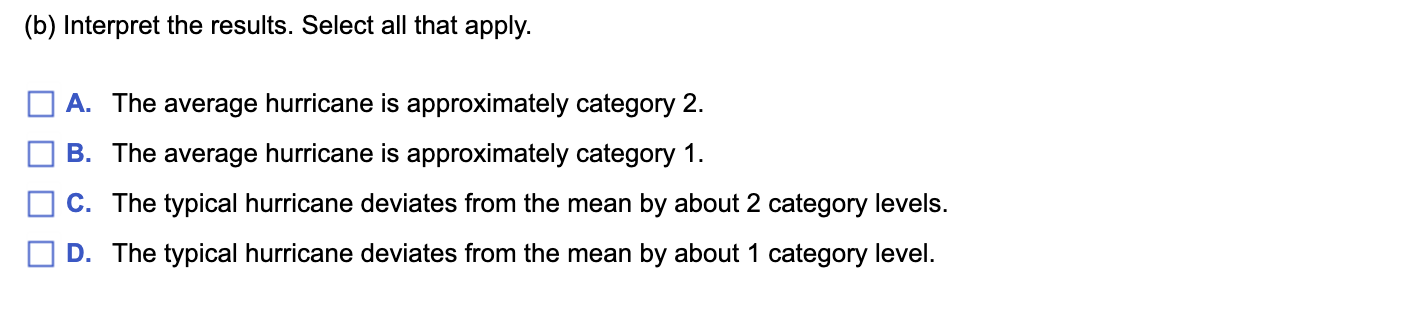
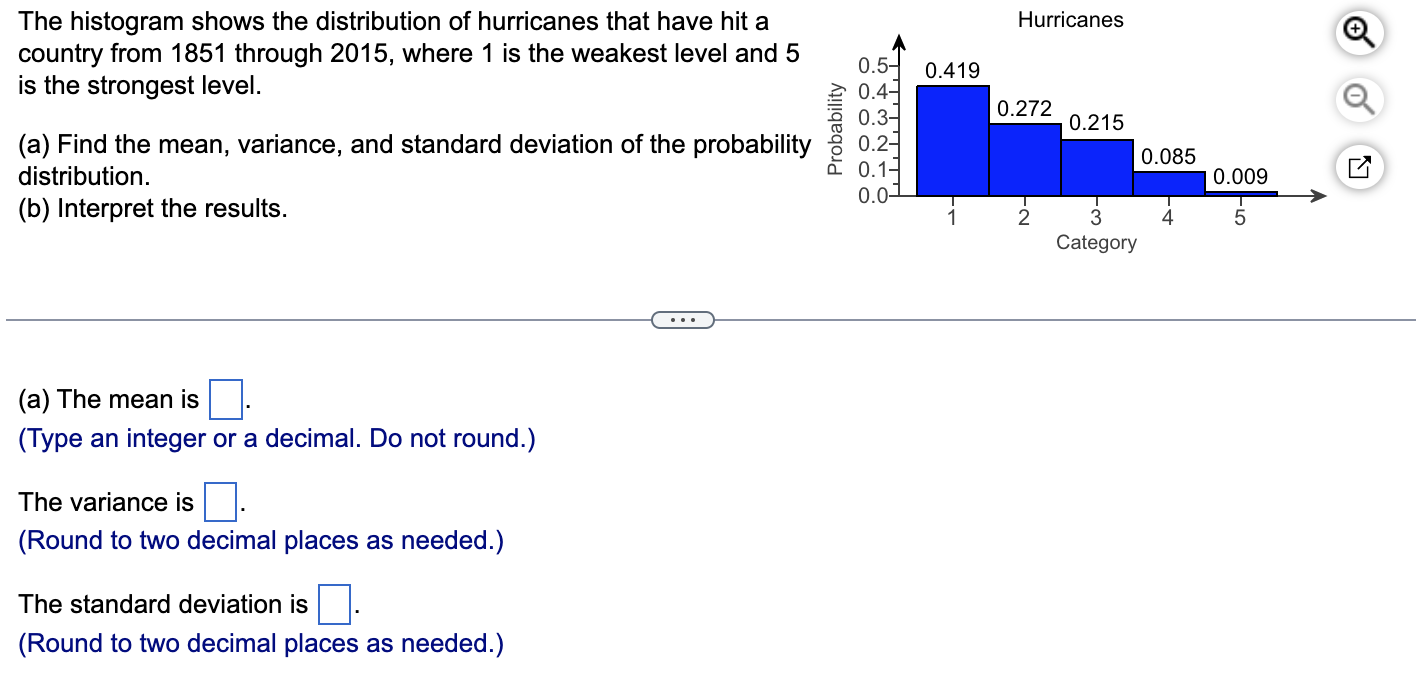
(b) Interpret the results. Select all that apply. |:| A. The average hurricane is approximately category 2. |:| B. The average hurricane is approximately category 1. |:| C. The typical hurricane deviates from the mean by about 2 category levels. El D. The typical hurricane deviates from the mean by about 1 category level. country from 1851 through 2015, where 1 is the weakest level and 5 The histogram shows the distribution of hurricanes that have hit 3 Hurricanes Q is the strongest level. Q (a) Find the mean, variance, and standard deviation of the probability distribution. (b) Interpret the results. Probability Category E (a) The mean is E. (Type an integer or a decimal. Do not round.) The variance is D. (Round to two decimal places as needed.) The standard deviation is D. (Round to two decimal places as needed.)
Step by Step Solution
There are 3 Steps involved in it

Get step-by-step solutions from verified subject matter experts