

Question: (b) Is this process capable of 5-sigma performance? What statistic helps you reach your conclusion, and what is the value of that statistic? (c) Explain
(b) Is this process capable of 5-sigma performance? What statistic helps you reach your conclusion, and what is the value of that statistic?
(c) Explain what action needs to be taken to ensure the process is 5-sigma capable? What statistic helps you reach your conclusion, and what is the value of that statistic? What should be the new value of the parameter you decided to improve?
 PLEASE ANSWER ALL PARTS INCLUDING EVERYTHING.
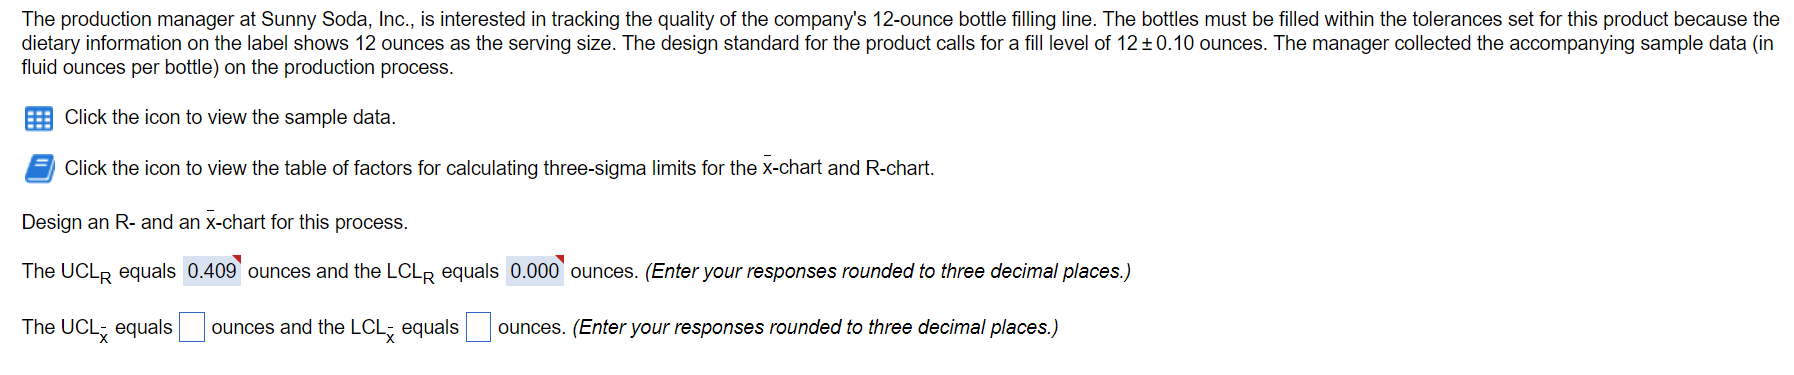
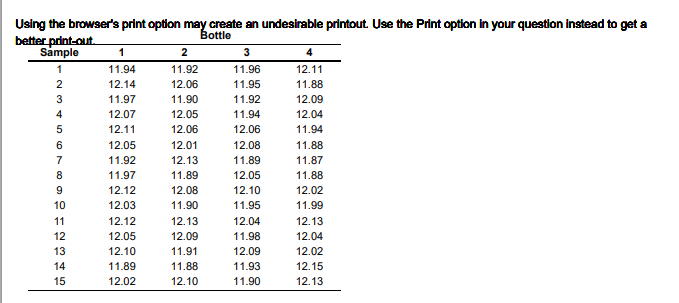
fluid ounces per bottle) on the production process. Click the icon to view the sample data. Click the icon to view the table of factors for calculating three-sigma limits for the x-chart and R-chart. Design an R- and an xchart for this process. The LR equals ounces and the LCLR equals ounces. (Enter your responses rounded to three decimal places.) The Ux equals ounces and the LCLx equals ounces. (Enter your responses rounded to three decimal places.) Using the browser's print option may create an undesirable printout. Use the Print option In your question instead to get a fluid ounces per bottle) on the production process. Click the icon to view the sample data. Click the icon to view the table of factors for calculating three-sigma limits for the x-chart and R-chart. Design an R- and an xchart for this process. The LR equals ounces and the LCLR equals ounces. (Enter your responses rounded to three decimal places.) The Ux equals ounces and the LCLx equals ounces. (Enter your responses rounded to three decimal places.) Using the browser's print option may create an undesirable printout. Use the Print option In your question instead to get a
Step by Step Solution
There are 3 Steps involved in it

Get step-by-step solutions from verified subject matter experts