

Question: b. Plot the projects SPI, CPI, vs. time period on a single graph. c. Plot the projects EV, ACWP vs. time period on a single
 b. Plot the projects SPI, CPI, vs. time period on a single graph.
c. Plot the projects EV, ACWP vs. time period on a single graph.
d. Explain to the owner your assessment of the project at the end of period 4 and the future expected status of the project completion. Justify your answers by referring to your calculations and graphs.
At what stage of completion (percent complete) is the project?
Is the project currently over budget or below budget?
Is the project currently ahead of schedule or behind schedule?
At the end of period 4, what is the best estimate of the final cost overrun or underrun of the project?
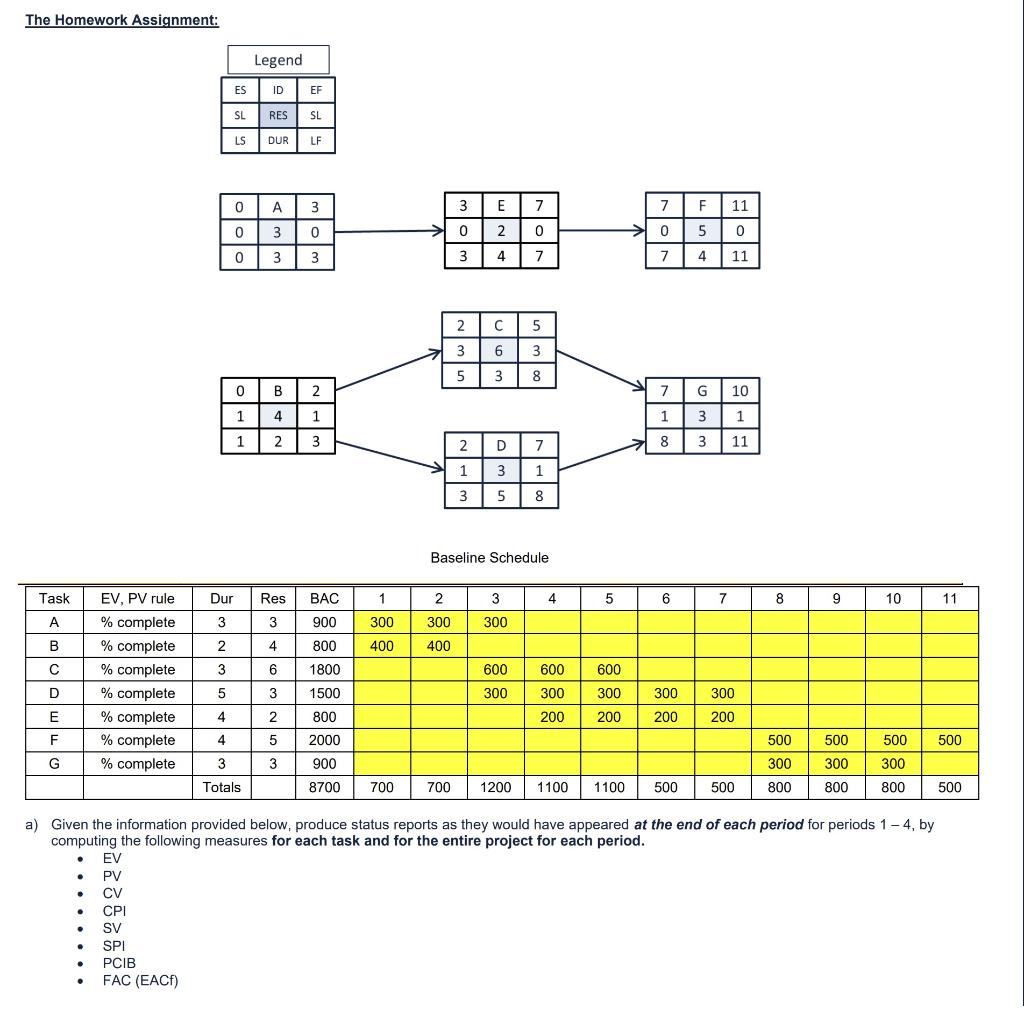
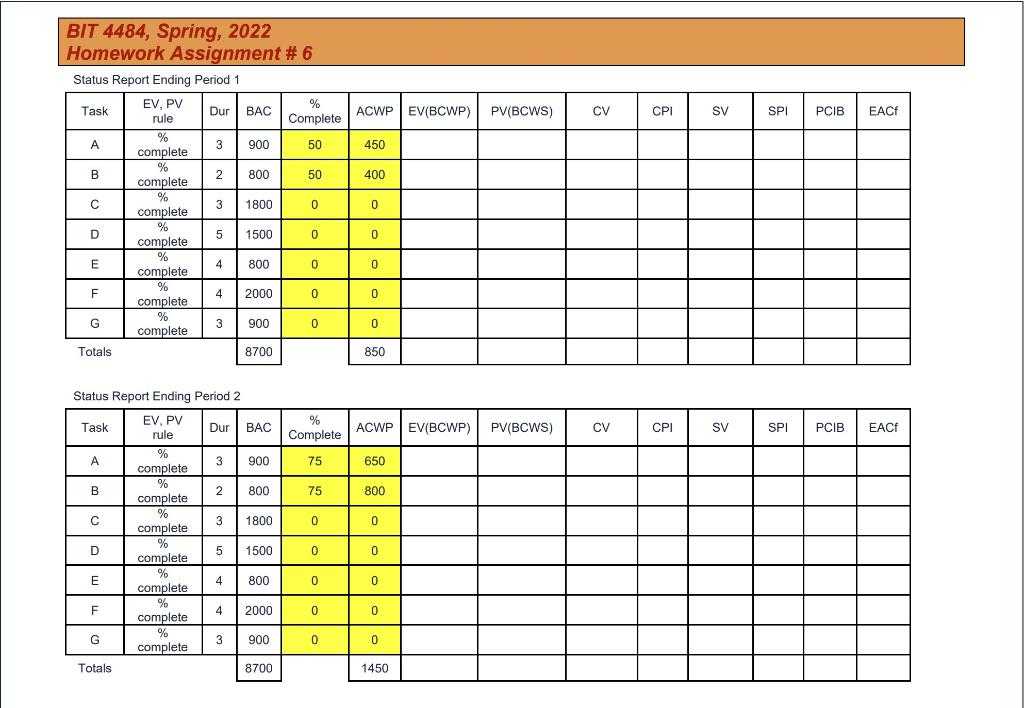
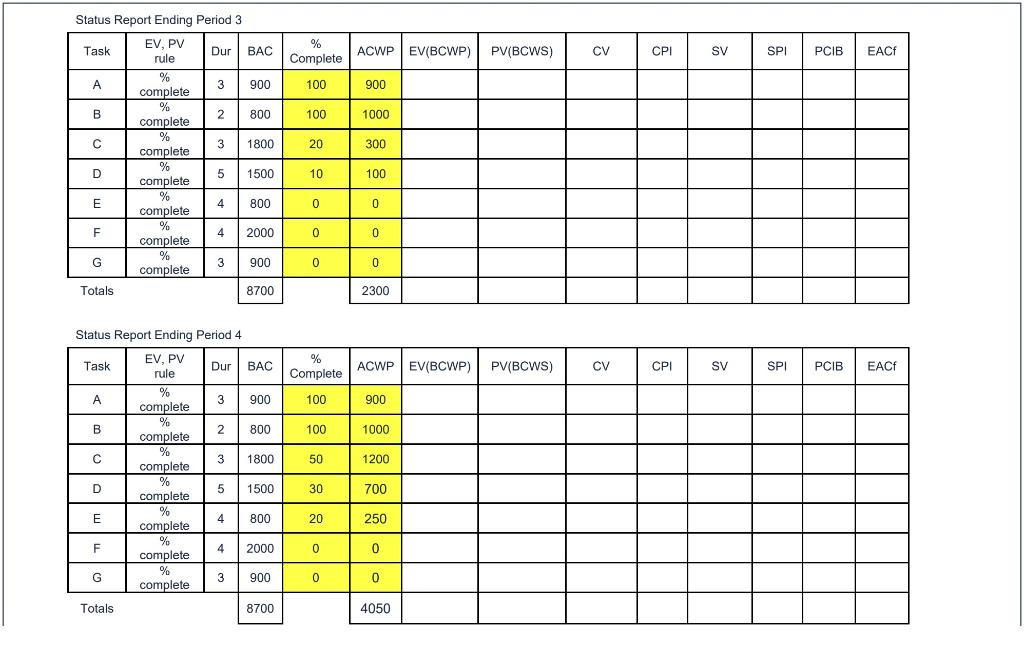
The Homework Assignment: Legend ID EF RES SL DUR LF A 3 3 0 0 3 3 0 B 2 1 4 1 1 2 3 ES SL LS 0 0 7 F 11 0 5 0 7 4 11 7 G 10 1 3 1 8 3 11 Task EV, PV rule Dur Res BAC 3 4 5 6 7 9 10 11 A % complete 3 3 900 300 B % complete 2 4 800 C % complete 3 6 1800 600 600 600 D % complete 5 3 1500 300 300 300 300 300 E % complete 4 2 800 200 200 200 200 F % complete 4 5 2000 500 500 500 500 G % complete 3 3 300 300 300 900 8700 Totals 700 700 1200 1100 1100 500 500 800 800 800 500 a) Given the information provided below, produce status reports as they would have appeared at the end of each period for periods 1-4, by computing the following measures for each task and for the entire project for each period. EV PV . CV CPI . SV . SPI PCIB FAC (EAC) 3 0 3 2 3 5 E 2 4 7 0 7 5 3 8 C 6 3 2 D 7 1 3 1 3 5 8 Baseline Schedule 1 2 300 300 400 400 8 BIT 4484, Spring, 2022 Homework Assignment # 6 Status Report Ending Period 1 % Task EV. PV rule Dur BAC Complete A 3 900 50 B 2 800 50 3 1800 0 D % complete % complete % complete % complete % complete % complete % complete 5 1500 0 4 800 0 F 4 2000 0 G 3 900 0 Totals 8700 Status Report Ending Period 2 Task % Complete A 75 B 75 C 0 EV, PV rule % complete % complete % complete % complete % complete % complete % complete. D 0 E 0 F 0 G 0 Totals E Dur BAC 3 900 2 800 3 1800 5 1500 4 800 4 2000 3 900 8700 ACWP EV(BCWP) PV(BCWS) CV 450 400 0 0 0 0 0 850 ACWP EV(BCWP) PV(BCWS) CV 650 800 0 0 0 0 0 1450 CPI CPI SV SV SPI SPI PCIB PCIB EACf EACf Status Report Ending Period 3 Task EV, PV rule % A B complete % complete % complete % C D E complete % complete % complete % complete F G Totals Status Report Ending Period 4 Task EV, PV rule A % complete % B C complete % complete % D complete % complete % complete % complete E F G Totals Dur BAC 3 900 2 800 3 1800 5 1500 4 800 4 2000 3 900 8700 Dur BAC 3 900 2 800 3 1800 5 1500 4 800 4 2000 3 900 8700 % Complete 100 100 20 10 0 0 0 % Complete 100 100 50 30 20 0 0 ACWP EV(BCWP) 900 1000 300 100 0 0 0 2300 ACWP EV(BCWP) 900 1000 1200 700 250 0 0 4050 PV(BCWS) PV(BCWS) CV CPI SV CV CPI SV SPI PCIB EACf SPI PCIB EACf The Homework Assignment: Legend ID EF RES SL DUR LF A 3 3 0 0 3 3 0 B 2 1 4 1 1 2 3 ES SL LS 0 0 7 F 11 0 5 0 7 4 11 7 G 10 1 3 1 8 3 11 Task EV, PV rule Dur Res BAC 3 4 5 6 7 9 10 11 A % complete 3 3 900 300 B % complete 2 4 800 C % complete 3 6 1800 600 600 600 D % complete 5 3 1500 300 300 300 300 300 E % complete 4 2 800 200 200 200 200 F % complete 4 5 2000 500 500 500 500 G % complete 3 3 300 300 300 900 8700 Totals 700 700 1200 1100 1100 500 500 800 800 800 500 a) Given the information provided below, produce status reports as they would have appeared at the end of each period for periods 1-4, by computing the following measures for each task and for the entire project for each period. EV PV . CV CPI . SV . SPI PCIB FAC (EAC) 3 0 3 2 3 5 E 2 4 7 0 7 5 3 8 C 6 3 2 D 7 1 3 1 3 5 8 Baseline Schedule 1 2 300 300 400 400 8 BIT 4484, Spring, 2022 Homework Assignment # 6 Status Report Ending Period 1 % Task EV. PV rule Dur BAC Complete A 3 900 50 B 2 800 50 3 1800 0 D % complete % complete % complete % complete % complete % complete % complete 5 1500 0 4 800 0 F 4 2000 0 G 3 900 0 Totals 8700 Status Report Ending Period 2 Task % Complete A 75 B 75 C 0 EV, PV rule % complete % complete % complete % complete % complete % complete % complete. D 0 E 0 F 0 G 0 Totals E Dur BAC 3 900 2 800 3 1800 5 1500 4 800 4 2000 3 900 8700 ACWP EV(BCWP) PV(BCWS) CV 450 400 0 0 0 0 0 850 ACWP EV(BCWP) PV(BCWS) CV 650 800 0 0 0 0 0 1450 CPI CPI SV SV SPI SPI PCIB PCIB EACf EACf Status Report Ending Period 3 Task EV, PV rule % A B complete % complete % complete % C D E complete % complete % complete % complete F G Totals Status Report Ending Period 4 Task EV, PV rule A % complete % B C complete % complete % D complete % complete % complete % complete E F G Totals Dur BAC 3 900 2 800 3 1800 5 1500 4 800 4 2000 3 900 8700 Dur BAC 3 900 2 800 3 1800 5 1500 4 800 4 2000 3 900 8700 % Complete 100 100 20 10 0 0 0 % Complete 100 100 50 30 20 0 0 ACWP EV(BCWP) 900 1000 300 100 0 0 0 2300 ACWP EV(BCWP) 900 1000 1200 700 250 0 0 4050 PV(BCWS) PV(BCWS) CV CPI SV CV CPI SV SPI PCIB EACf SPI PCIB EACf
Step by Step Solution
There are 3 Steps involved in it

Get step-by-step solutions from verified subject matter experts