

Question: b) The 95% confidence interval for the slope is (-1.37, -0.67). Interpret this interval. We are 95% confident that ... A. The sample slope is
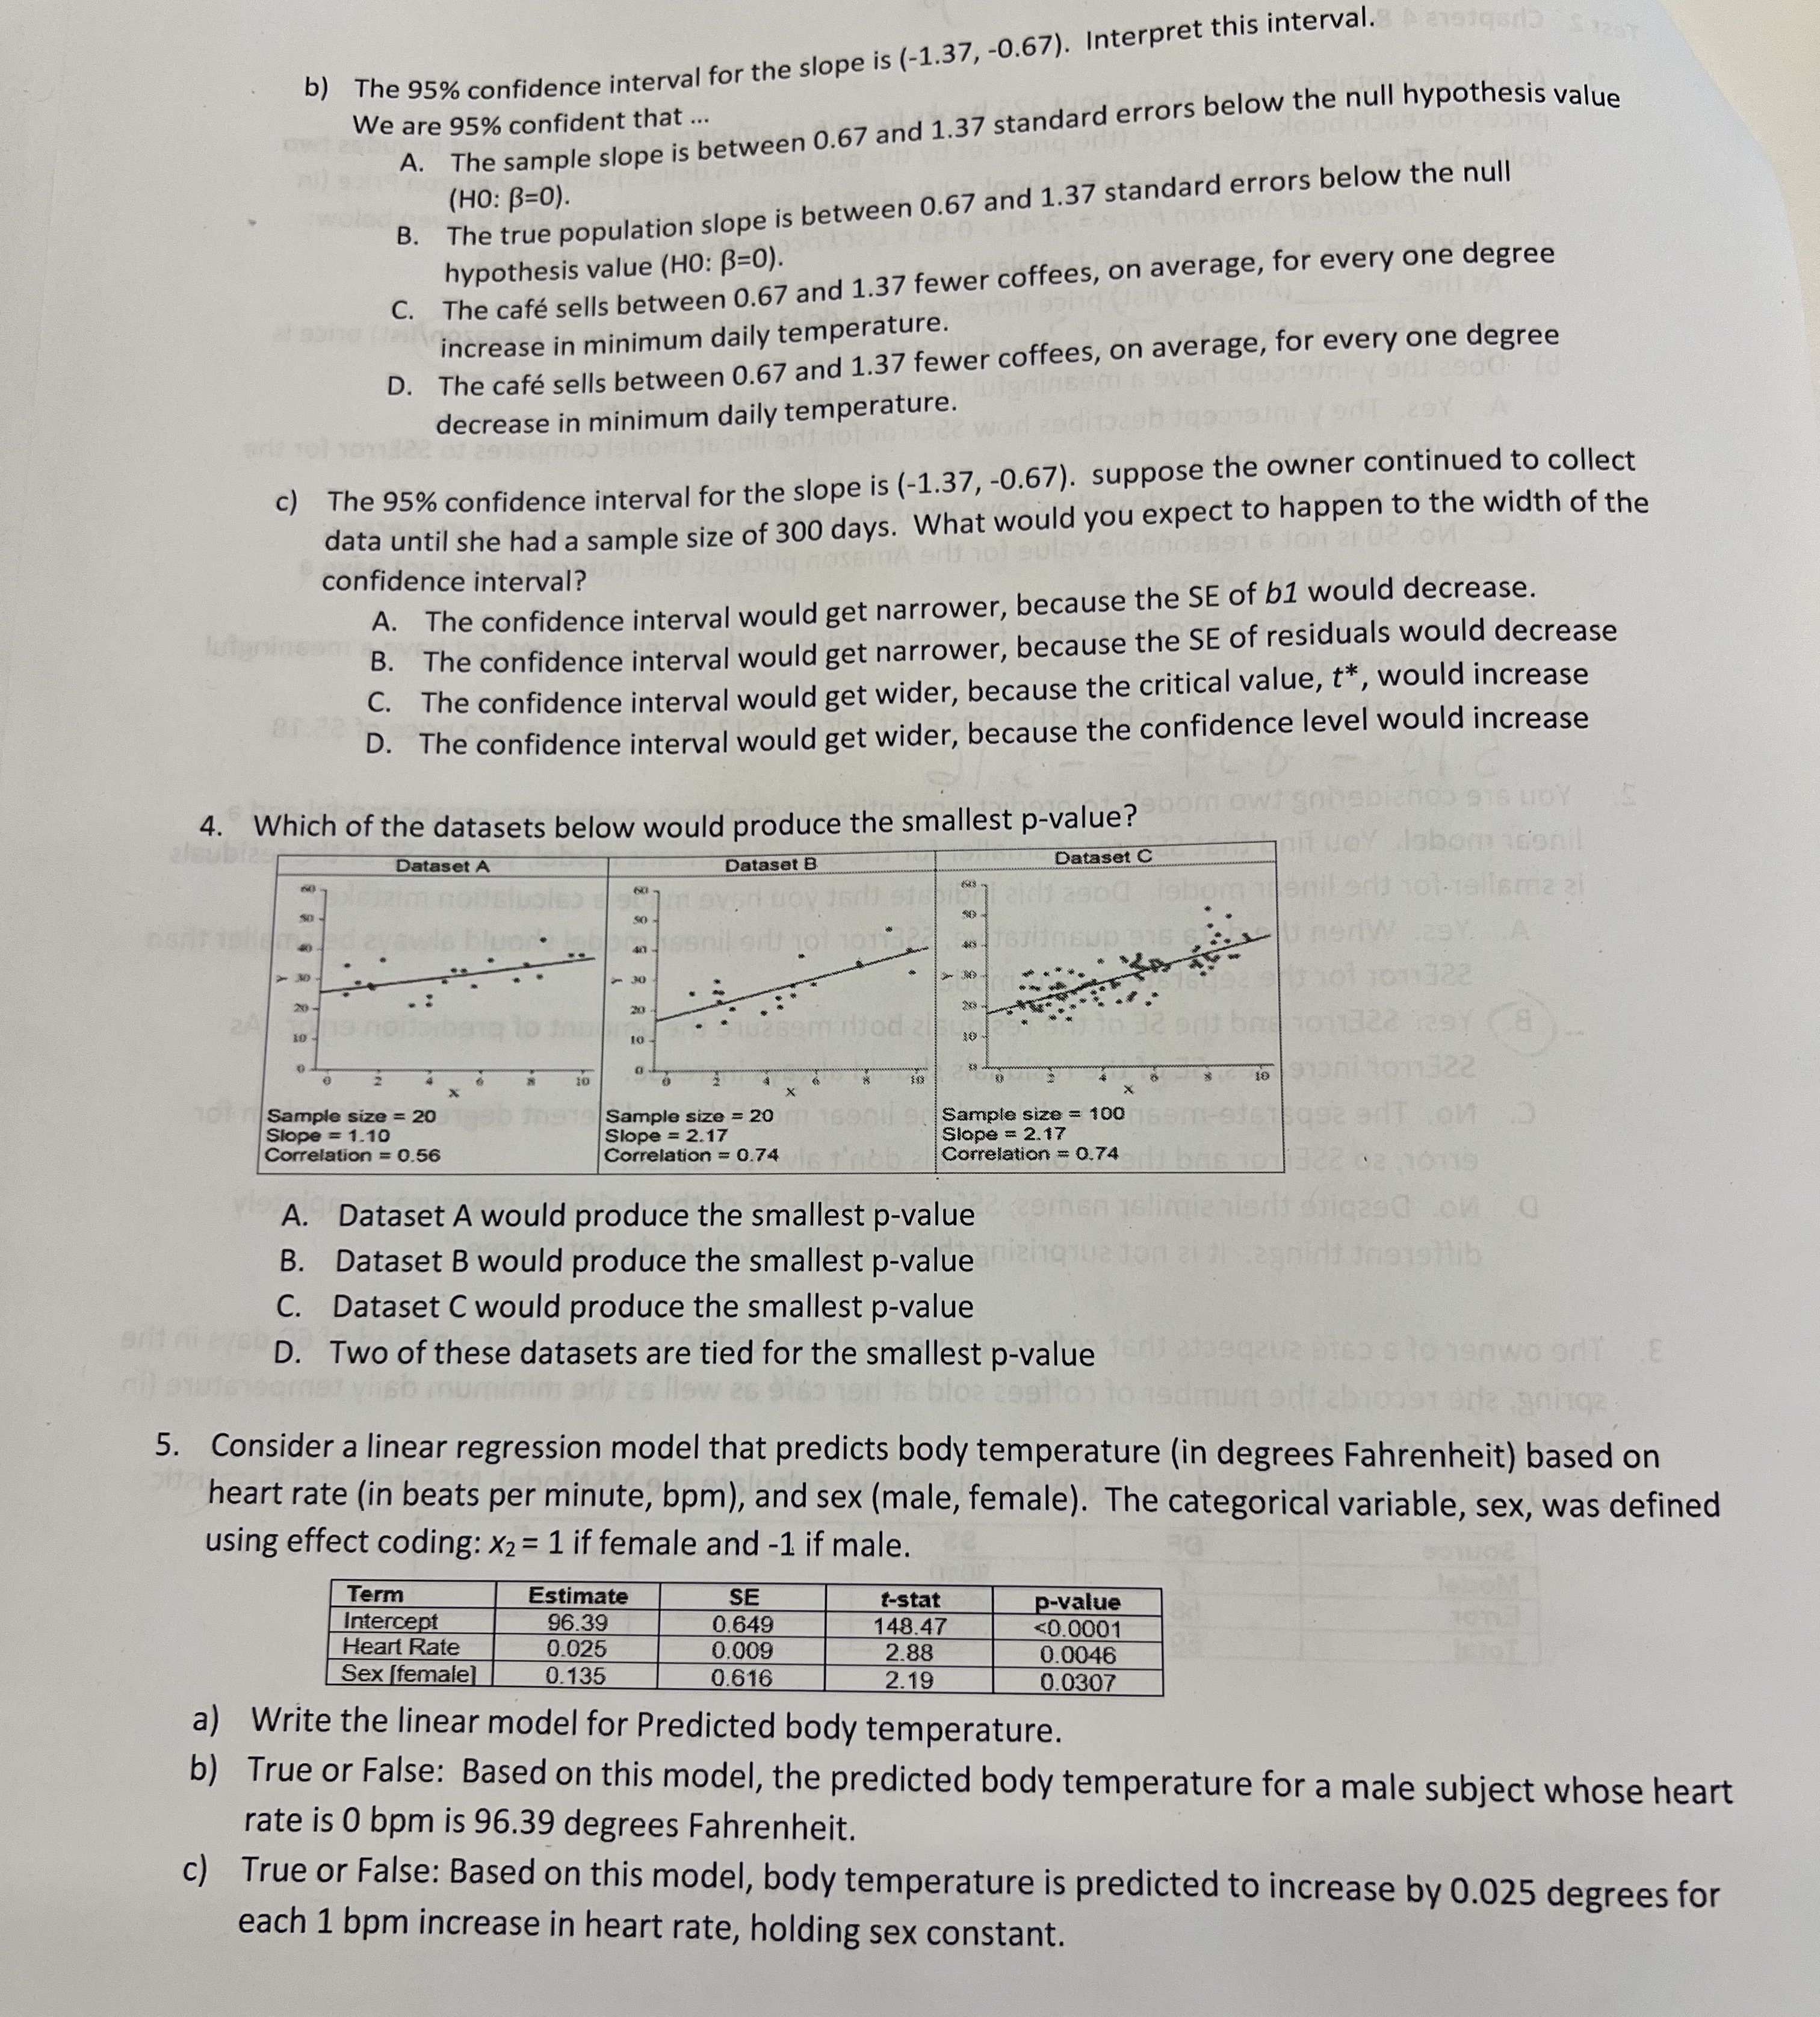


b) The 95% confidence interval for the slope is (-1.37, -0.67). Interpret this interval. We are 95% confident that ... A. The sample slope is between 0.67 and 1.37 standard errors below the null hypothesis value (HO: B=0). B. The true population slope is between 0.67 and 1.37 standard errors below the null hypothesis value (HO: B=0). C. The cafe sells between 0.67 and 1.37 fewer coffees, on average, for every one degree increase in minimum daily temperature. D. The cafe sells between 0.67 and 1.37 fewer coffees, on average, for every one degree decrease in minimum daily temperature. C ) The 95% confidence interval for the slope is (-1.37, -0.67). suppose the owner continued to collect data until she had a sample size of 300 days. What would you expect to happen to the width of the confidence interval? A. The confidence interval would get narrower, because the SE of b1 would decrease. lutuningon B. The confidence interval would get narrower, because the SE of residuals would decrease C. The confidence interval would get wider, because the critical value, t*, would increase D. The confidence interval would get wider, because the confidence level would increase 4. Which of the datasets below would produce the smallest p-value? Dataset C 1yay lobomissnil Dataset A Dataset B new ex. A 10 7071328 RBY C8 Sample size = 20 Sample size = 20 Slope = 1.10 Slope = 2.1 Sample size = 100 Slope = 2.17 que ent .on 3 Correlation = 0.56 Correlation = 0.74 Correlation = 0.74 A. Dataset A would produce the smallest p-value comen ielimienisnt digeed on a B. Dataset B would produce the smallest p-value Jon ei s C. Dataset C would produce the smallest p-value D. Two of these datasets are tied for the smallest p-value 5. Consider a linear regression model that predicts body temperature (in degrees Fahrenheit) based on heart rate (in beats per minute, bpm), and sex (male, female). The categorical variable, sex, was defined using effect coding: X2 = 1 if female and -1 if male. Term Estimate SE t-stat Intercept o-Value 96.39 0.649 148.47 Heart Rate 0.025
Step by Step Solution
There are 3 Steps involved in it

Get step-by-step solutions from verified subject matter experts