

Question: B. The average exam score for 10 students in a statistics class was 85. One student dropped the class, changing the average exam score of
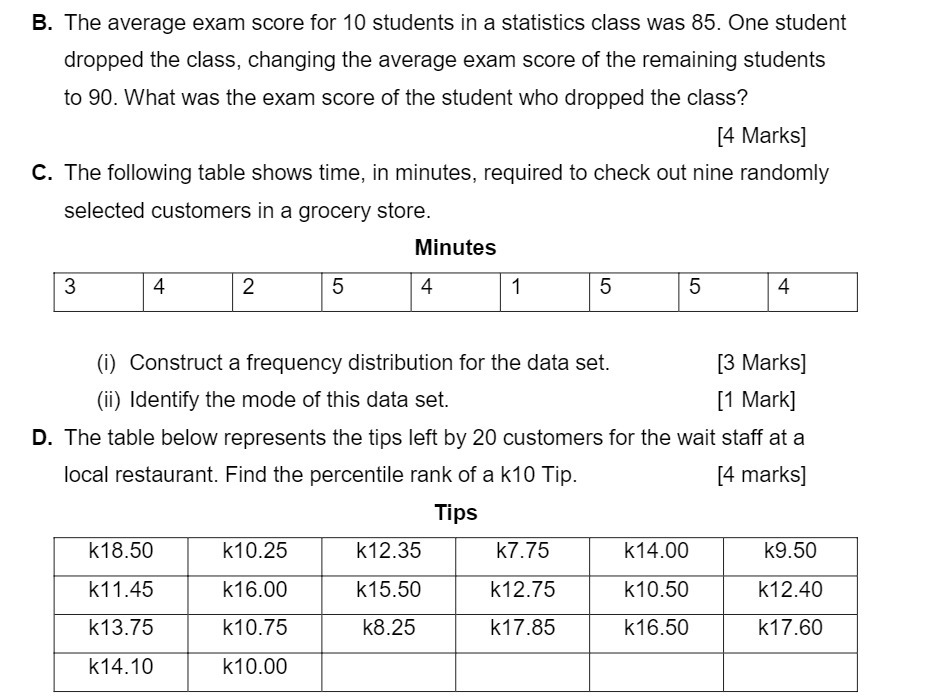

B. The average exam score for 10 students in a statistics class was 85. One student dropped the class, changing the average exam score of the remaining students to 90. What was the exam score of the student who dropped the class? [4 Marks] C. The following table shows time, in minutes, required to check out nine randomly selected customers in a grocery store. Minutes 3 4 2 5 4 1 5 5 4 (i) Construct a frequency distribution for the data set. [3 Marks] (ii) Identify the mode of this data set. [1 Mark] D. The table below represents the tips left by 20 customers for the wait staff at a local restaurant. Find the percentile rank of a mo Tip. [4 marks] Tips k18.50 k10.25 k12.35 k7.75 k14.00 k9.50 M1 45 k16.00 k15.50 k12.75 k10.50 k12.40 R1375 R1075 k8.25 R1735 k16.50 k17.50 k14.10 k10.00
Step by Step Solution
There are 3 Steps involved in it

Get step-by-step solutions from verified subject matter experts