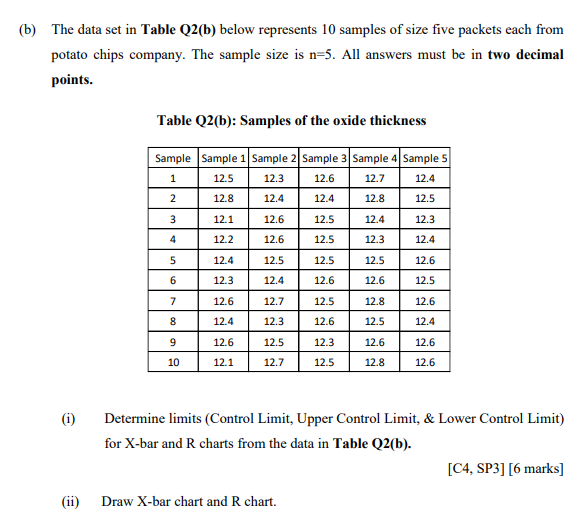
Question: (b) The data set in Table Q2(b) below represents 10 samples of size five packets each from potato chips company. The sample size is n=5.

(b) The data set in Table Q2(b) below represents

(b) The data set in Table Q2(b) below represents 10 samples of size five packets each from potato chips company. The sample size is n=5. All answers must be in two decimal points. (i) (ii) Table Q2(b): Samples of the oxide thickness Sample Sample 1 Sample 2 Sample 3 Sample 4 Sample 5 1 12.5 12.3 12.6 12.7 12.4 12.8 12.4 12.4 12.8 12.5 12.1 12.5 12.4 12.3 12.2 12.5 12.3 12.4 12.4 12.5 12.5 12.6 12.3 12.6 12.6 12.5 12.6 12.5 12.8 12.6 12.4 12.6 12.5 12.4 12.6 12.3 12.6 12.6 12.1 12.5 12.8 12.6 2 3 4 5 6 7 8 9 10 12.6 12.6 12.5 12.4 12.7 12.3 12.5 12.7 Determine limits (Control Limit, Upper Control Limit, & Lower Control Limit) for X-bar and R charts from the data in Table Q2(b). Draw X-bar chart and R chart. [C4, SP3] [6 marks]

Step by Step Solution

There are 3 Steps involved in it

1 Expert Approved Answer
Step: 1 Unlock blur-text-image
Question Has Been Solved by an Expert!

Get step-by-step solutions from verified subject matter experts

Step: 2 Unlock
Step: 3 Unlock

Students Have Also Explored These Related General Management Questions!