

Question: I NEED THE ANSWER VERY URGENT PLSSSS.... The data set in Table Q2(b) below represents 10 samples of size five packets each from potato chips
I NEED THE ANSWER VERY URGENT PLSSSS....
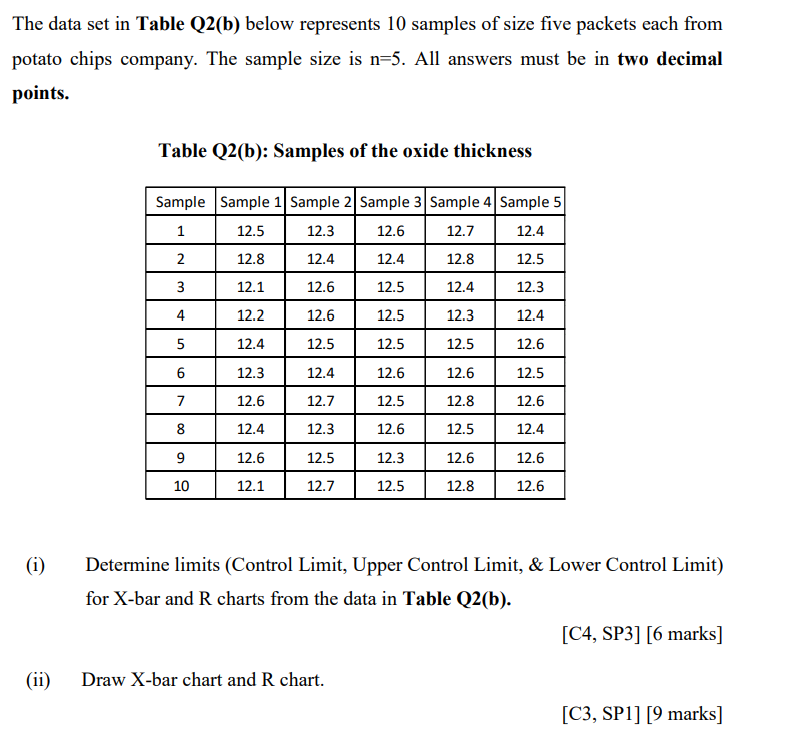
The data set in Table Q2(b) below represents 10 samples of size five packets each from potato chips company. The sample size is n=5. All answers must be in two decimal points. (i) (ii) Table Q2(b): Samples of the oxide thickness Sample Sample 1 Sample 2 Sample 3 Sample 4 Sample 5 1 12.5 12.3 12.6 12.7 12.4 2 12.8 12.4 12.4 12.8 12.5 3 12.1 12.6 12.5 12.4 12.3 4 12.2 12.6 12.5 12.3 12.4 5 12.4 12.5 12.5 12.5 12.6 6 12.3 12.4 12.6 12.6 12.5 7 12.6 12.7 12.5 12.8 12.6 8 12.4 12.3 12.6 12.5 12.4 9 12.6 12.5 12.3 12.6 12.6 10 12.1 12.7 12.5 12.8 12.6 Determine limits (Control Limit, Upper Control Limit, & Lower Control Limit) for X-bar and R charts from the data in Table Q2(b). Draw X-bar chart and R chart. [C4, SP3] [6 marks] [C3, SP1] [9 marks]Step by Step Solution
There are 3 Steps involved in it
1 Expert Approved Answer
Step: 1 Unlock

Question Has Been Solved by an Expert!
Get step-by-step solutions from verified subject matter experts
Step: 2 Unlock
Step: 3 Unlock