

Question: b. The following table gives data on monthly changes in the spot price and the futures price for a certain commodity. Use the data to
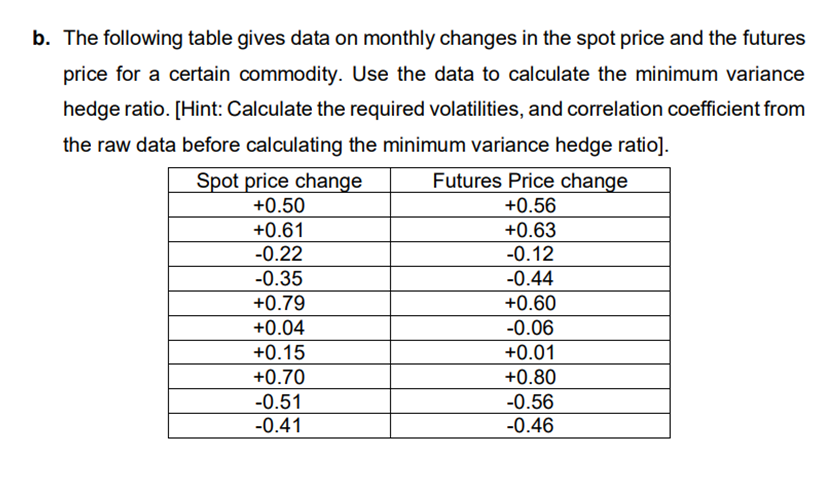
b. The following table gives data on monthly changes in the spot price and the futures price for a certain commodity. Use the data to calculate the minimum variance hedge ratio. (Hint: Calculate the required volatilities, and correlation coefficient from the raw data before calculating the minimum variance hedge ratio). Spot price change Futures Price change +0.50 +0.56 +0.61 +0.63 -0.22 -0.12 -0.35 -0.44 +0.79 +0.60 +0.04 -0.06 +0.15 +0.01 +0.70 +0.80 -0.51 -0.56 -0.41 -0.46
Step by Step Solution
There are 3 Steps involved in it
1 Expert Approved Answer
Step: 1 Unlock

Question Has Been Solved by an Expert!
Get step-by-step solutions from verified subject matter experts
Step: 2 Unlock
Step: 3 Unlock