

Question: (b) The graph below shows the relationship between enthalpy and temperature of water at 101.325kPa. Determine the enthalpy of saturated liquid water and the change
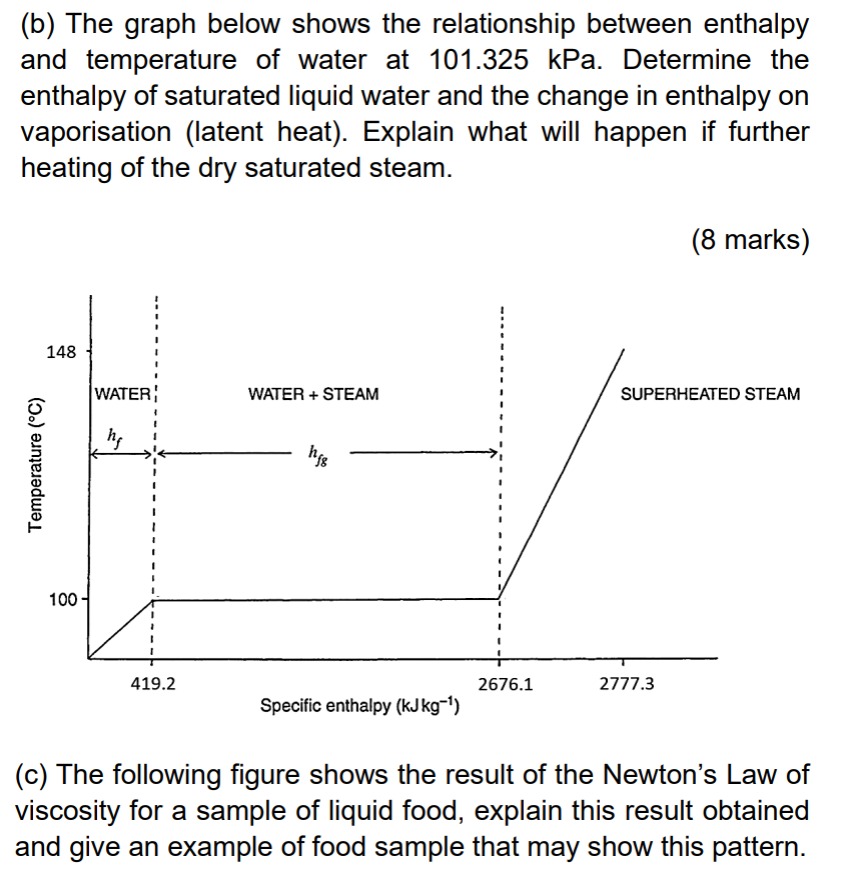
(b) The graph below shows the relationship between enthalpy and temperature of water at 101.325kPa. Determine the enthalpy of saturated liquid water and the change in enthalpy on vaporisation (latent heat). Explain what will happen if further heating of the dry saturated steam. (8 marks) (c) The following figure shows the result of the Newton's Law of viscosity for a sample of liquid food, explain this result obtained and give an example of food sample that may show this pattern
Step by Step Solution
There are 3 Steps involved in it
1 Expert Approved Answer
Step: 1 Unlock

Question Has Been Solved by an Expert!
Get step-by-step solutions from verified subject matter experts
Step: 2 Unlock
Step: 3 Unlock