

Question: b . Use an exponential smoothing with a linear trend model with smoothing constants = = 0 . 2 to develop a forecast for these
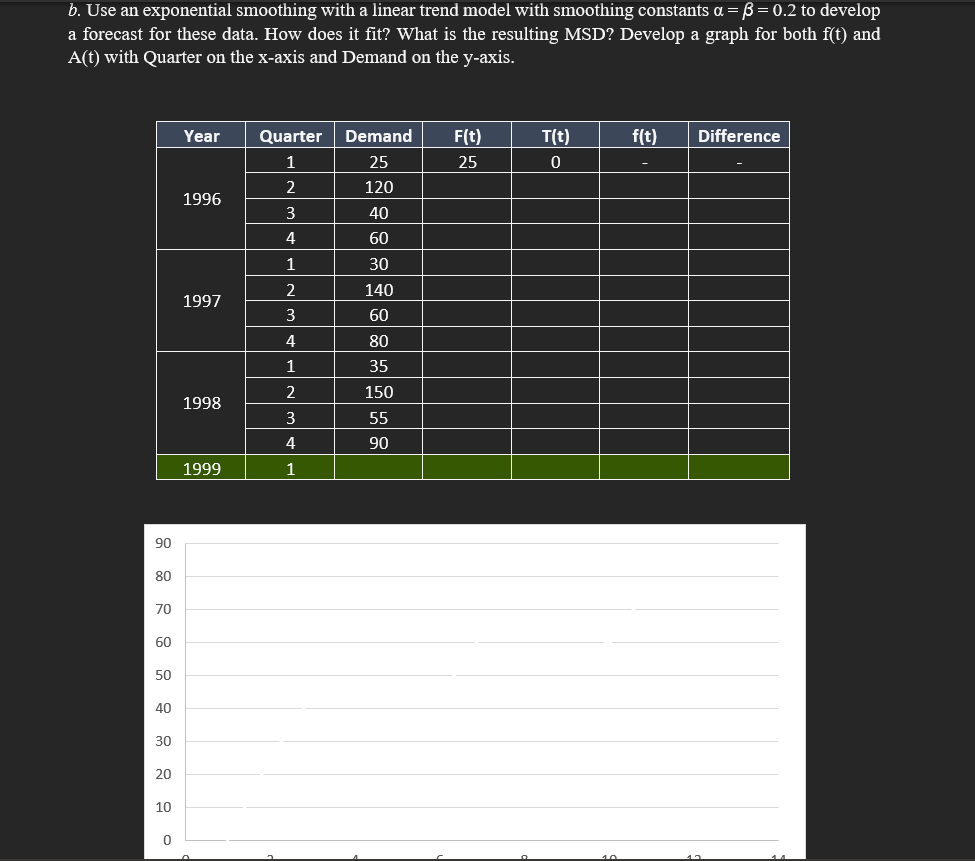
Use an exponential smoothing with a linear trend model with smoothing constants to develop a forecast for these data. How does it fit? What is the resulting MSD Develop a graph for both and with Quarter on the axis and Demand on the yaxis.
tableYearQuarter,Demand,Difference
Step by Step Solution
There are 3 Steps involved in it
1 Expert Approved Answer
Step: 1 Unlock

Question Has Been Solved by an Expert!
Get step-by-step solutions from verified subject matter experts
Step: 2 Unlock
Step: 3 Unlock