

Question: b. Using appropriate axes scale and labels, plot S-curves on the same sheet for the period January to June on the graph sheet provided using
b. Using appropriate axes scale and labels, plot S-curves on the same sheet for the period January to June on the graph sheet provided using :
i. Planned value (5)
ii. Actual cost (5)
iii. At what point(s) in time is (are) the actual and the planned spent equal; what is(are) the amount(s) - clearly indicate this (these) on graph? (5)
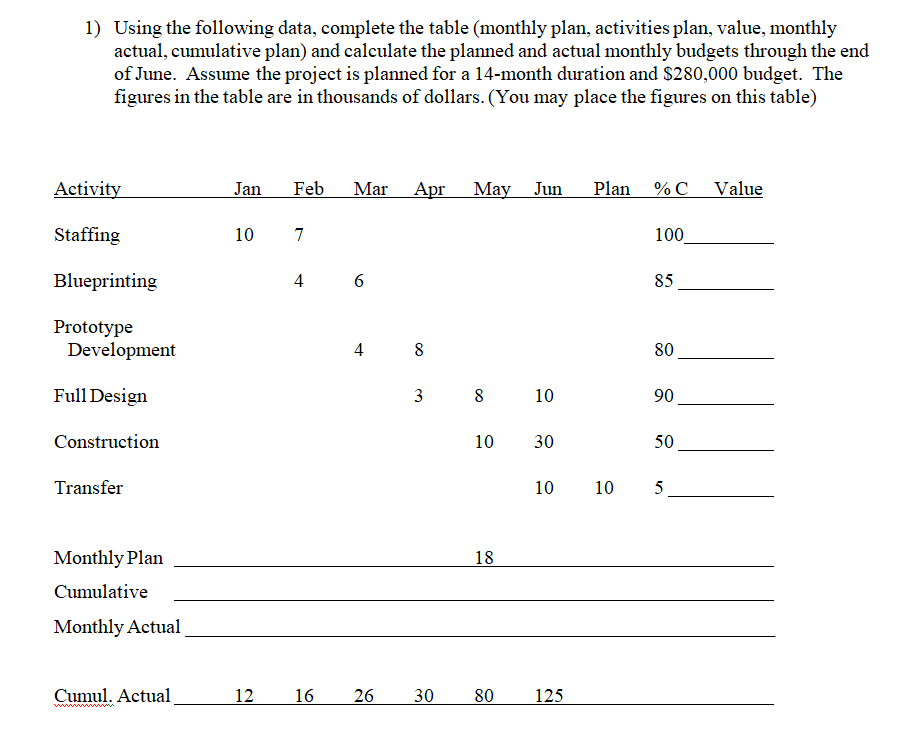
1) Using the following data, complete the table (monthly plan, activities plan, value, monthly actual, cumulative plan) and calculate the planned and actual monthly budgets through the end of June. Assume the project is planned for a 14-month duration and $280,000 budget. The figures in the table are in thousands of dollars. (You may place the figures on this table) Activity Jan Feb Mar Apr May Jun Plan %C Value Staffing 10 7 100 Blueprinting 4 6 85 Prototype Development 4 8 80 Full Design 3 8 10 90 Construction 10 30 50 Transfer 10 10 5 18 Monthly Plan Cumulative Monthly Actual Cumul. Actual 12 16 26 30 80 125 1) Using the following data, complete the table (monthly plan, activities plan, value, monthly actual, cumulative plan) and calculate the planned and actual monthly budgets through the end of June. Assume the project is planned for a 14-month duration and $280,000 budget. The figures in the table are in thousands of dollars. (You may place the figures on this table) Activity Jan Feb Mar Apr May Jun Plan %C Value Staffing 10 7 100 Blueprinting 4 6 85 Prototype Development 4 8 80 Full Design 3 8 10 90 Construction 10 30 50 Transfer 10 10 5 18 Monthly Plan Cumulative Monthly Actual Cumul. Actual 12 16 26 30 80 125
Step by Step Solution
There are 3 Steps involved in it

Get step-by-step solutions from verified subject matter experts