

Question: b) what is the upper control limit? c) what is the lower control limit? d) which sample/samples are out of control? e) to reduce the
b) what is the upper control limit?
c) what is the lower control limit?
d) which sample/samples are out of control?
e) to reduce the error rate, which of the following techniques can be utilized?
-fish bone chart
-pareto chart
-brainstorming
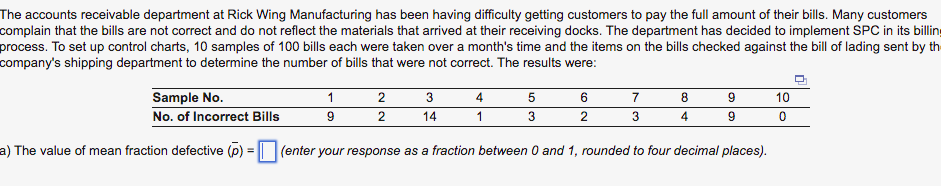
-he accounts receivable department at Rick Wing Manufacturing has been having difficulty getting customers to pay the full amount of their bills. Many customers omplain that the bills are not correct and do not reflect the materials that arrived at their receiving docks. The department has decided to implement SPili rocess. To set up control charts, 10 samples of 100 bills each were taken over a month's time and the items on the bills checked against the bill of lading sent by ompany's shipping department to determine the number of bills that were not correct. The results were: ) The value of mean fraction defective (p)= (enter your response as a fraction between 0 and 1 , rounded to four decimal places)Step by Step Solution
There are 3 Steps involved in it
1 Expert Approved Answer
Step: 1 Unlock

Question Has Been Solved by an Expert!
Get step-by-step solutions from verified subject matter experts
Step: 2 Unlock
Step: 3 Unlock