

Question: B) With Z=3, the control limits for the mean chart are: UCL-x= ounces LCLx= ounces? C) The control limits for the R-chart are UCLr= ounces
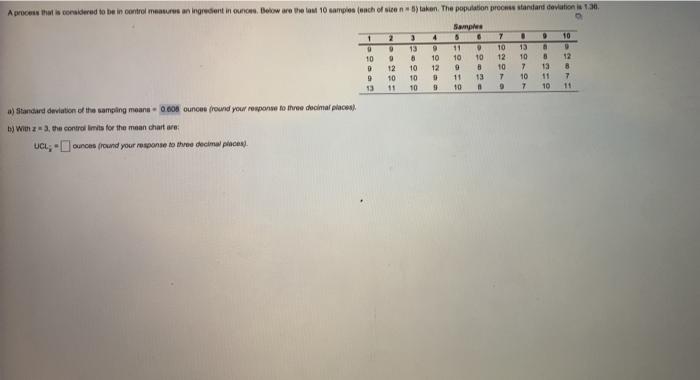
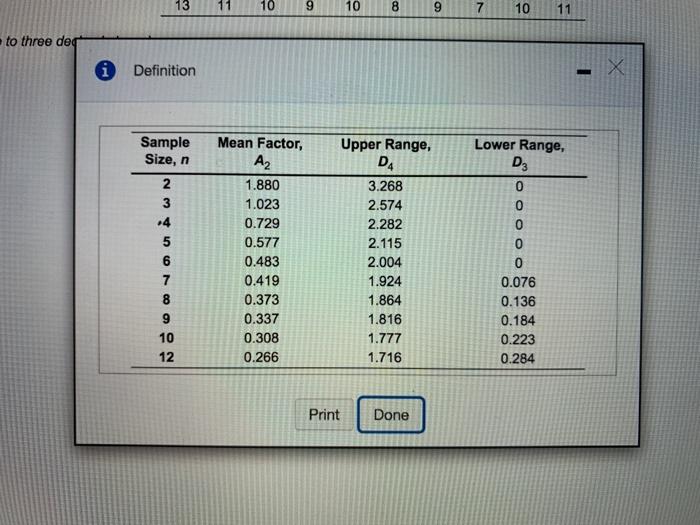
Aprocess that is considered to be in control memurus un ingredient in euron teow are the low 10 carpen (unch of soon as then. The population process Mandard deviation is 2 3 4 0 10 0 10 D 9 13 9 12 10 11 13 6 10 10 10 10 12 D 9 Samples 5 0 11 10 10 9 B 11 13 10 7 10 12 10 7 . 13 10 7 10 7 8 13 11 10 12 B 7 11 a) Standard deviation of the sampling means - 0.608 ounces fround your response to three decimal places) hy With the controllimits for the moon chartre: Ua; -Ounces fround your response to three decrew price 13 11 10 9 10 8 9 7 10 11 to three det * Definition X Sample Size, n 2 3 .4 5 6 7 8 9 10 12 Mean Factor, A2 1.880 1.023 0.729 0.577 0.483 0.419 0.373 0.337 0.308 0.266 Lower Range, D 0 0 0 0 Upper Range, D4 3.268 2.574 2.282 2.115 2.004 1.924 1.864 1.816 1.777 1.716 O O O 0.076 0.136 0.184 0.223 0.284 Print Done Aprocess that is considered to be in control memurus un ingredient in euron teow are the low 10 carpen (unch of soon as then. The population process Mandard deviation is 2 3 4 0 10 0 10 D 9 13 9 12 10 11 13 6 10 10 10 10 12 D 9 Samples 5 0 11 10 10 9 B 11 13 10 7 10 12 10 7 . 13 10 7 10 7 8 13 11 10 12 B 7 11 a) Standard deviation of the sampling means - 0.608 ounces fround your response to three decimal places) hy With the controllimits for the moon chartre: Ua; -Ounces fround your response to three decrew price 13 11 10 9 10 8 9 7 10 11 to three det * Definition X Sample Size, n 2 3 .4 5 6 7 8 9 10 12 Mean Factor, A2 1.880 1.023 0.729 0.577 0.483 0.419 0.373 0.337 0.308 0.266 Lower Range, D 0 0 0 0 Upper Range, D4 3.268 2.574 2.282 2.115 2.004 1.924 1.864 1.816 1.777 1.716 O O O 0.076 0.136 0.184 0.223 0.284 Print Done
Step by Step Solution
There are 3 Steps involved in it

Get step-by-step solutions from verified subject matter experts