

Question: A process that is considered to be in control measures an ingredient in ounces. Below are the last 10 samples (each of size n=5 )
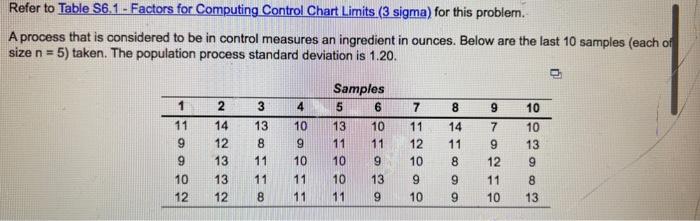
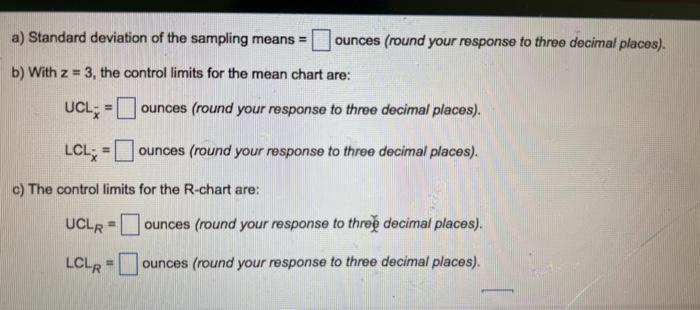
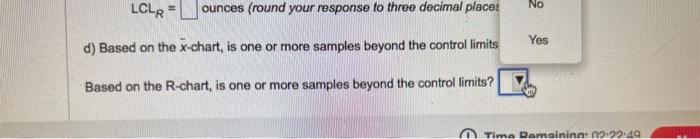
A process that is considered to be in control measures an ingredient in ounces. Below are the last 10 samples (each of size n=5 ) taken. The population process standard deviation is 1.20 . a) Standard deviation of the sampling means = ounces (round your response to three decimal places). b) With z=3, the control limits for the mean chart are: UCLx= ounces (round your response to three decimal places). LCLx= ounces (round your response to three decimal places). c) The control limits for the R-chart are: UCLR= ounces (round your response to thr decimal places). LCLR= ounces (round your response to three decimal places). LCLR= ounces (round your response to three decimal places d) Based on the x-chart, is one or more samples beyond the control limits Based on the R-chart, is one or more samples beyond the control limits
Step by Step Solution
There are 3 Steps involved in it

Get step-by-step solutions from verified subject matter experts