

Question: b) Write a program that demonstrates the Least Squares Curve Fitting method. You must write and call at least the following 3 functions: lef CubicSpline
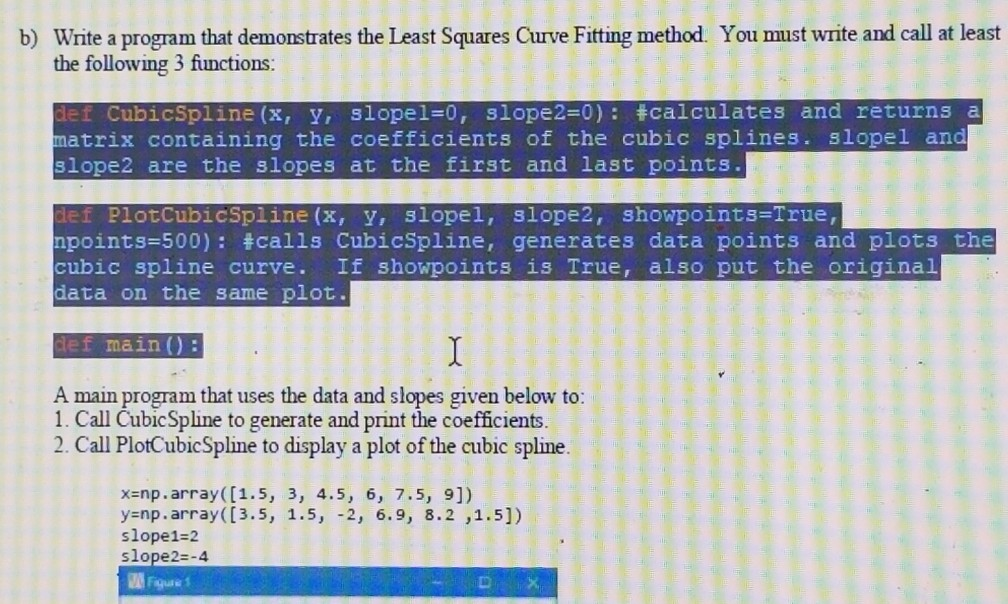
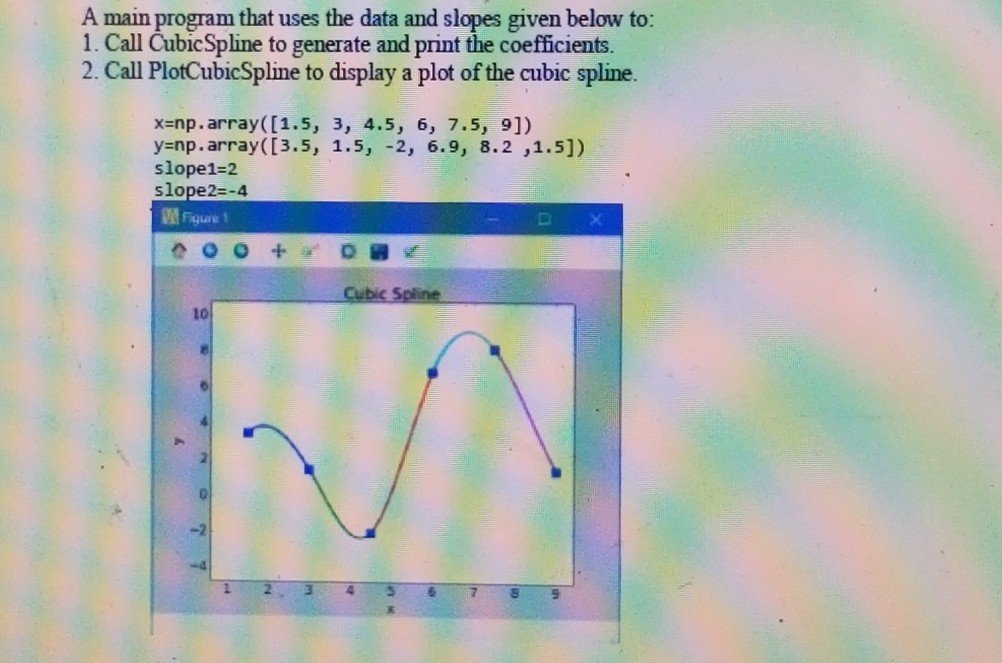
b) Write a program that demonstrates the Least Squares Curve Fitting method. You must write and call at least the following 3 functions: lef CubicSpline (x, y, slopel=0, slope2=0): #calculates and returns a matrix containing the coefficients of the cubic splines. slopel and slope2 are the slopes at the first and last points. to it to def PlotCubicSpline (x, y, slopel, slope2, showpoints=True, npoints=500): #calls CubicSpline, generates data points and plots the cubic spline curve. I le, also put the original data on the same plot. CO def main (): Y A main program that uses the data and slopes given below to: 1. Call Cubic Spline to generate and print the coefficients. 2. Call PlotCubicSpline to display a plot of the cubic spline. x=np.array((1.5, 3, 4.5, 6, 7.5, 9] y=np.array([3.5, 1.5, -2, 6.9, 8.2 ,1.5)) slope1=2 slope2=-4 a A main program that uses the data and slopes given below to: 1. Call Cubic Spline to generate and print the coefficients. 2. Call PlotCubicSpline to display a plot of the cubic spline. x=np. array([1.5, 3, 4.5, 6, 7.5, 9]) y=np.array([3.5, 1.5, -2, 6.9, 8.2 ,1.5]) slope1=2 slope2=-4 M Figure b) Write a program that demonstrates the Least Squares Curve Fitting method. You must write and call at least the following 3 functions: lef CubicSpline (x, y, slopel=0, slope2=0): #calculates and returns a matrix containing the coefficients of the cubic splines. slopel and slope2 are the slopes at the first and last points. to it to def PlotCubicSpline (x, y, slopel, slope2, showpoints=True, npoints=500): #calls CubicSpline, generates data points and plots the cubic spline curve. I le, also put the original data on the same plot. CO def main (): Y A main program that uses the data and slopes given below to: 1. Call Cubic Spline to generate and print the coefficients. 2. Call PlotCubicSpline to display a plot of the cubic spline. x=np.array((1.5, 3, 4.5, 6, 7.5, 9] y=np.array([3.5, 1.5, -2, 6.9, 8.2 ,1.5)) slope1=2 slope2=-4 a A main program that uses the data and slopes given below to: 1. Call Cubic Spline to generate and print the coefficients. 2. Call PlotCubicSpline to display a plot of the cubic spline. x=np. array([1.5, 3, 4.5, 6, 7.5, 9]) y=np.array([3.5, 1.5, -2, 6.9, 8.2 ,1.5]) slope1=2 slope2=-4 M Figure
Step by Step Solution
There are 3 Steps involved in it

Get step-by-step solutions from verified subject matter experts