

Question: B29: * (you may complete this question using MS Excel if you prefer) The following tables shows the mean returns and closing share prices yesterday
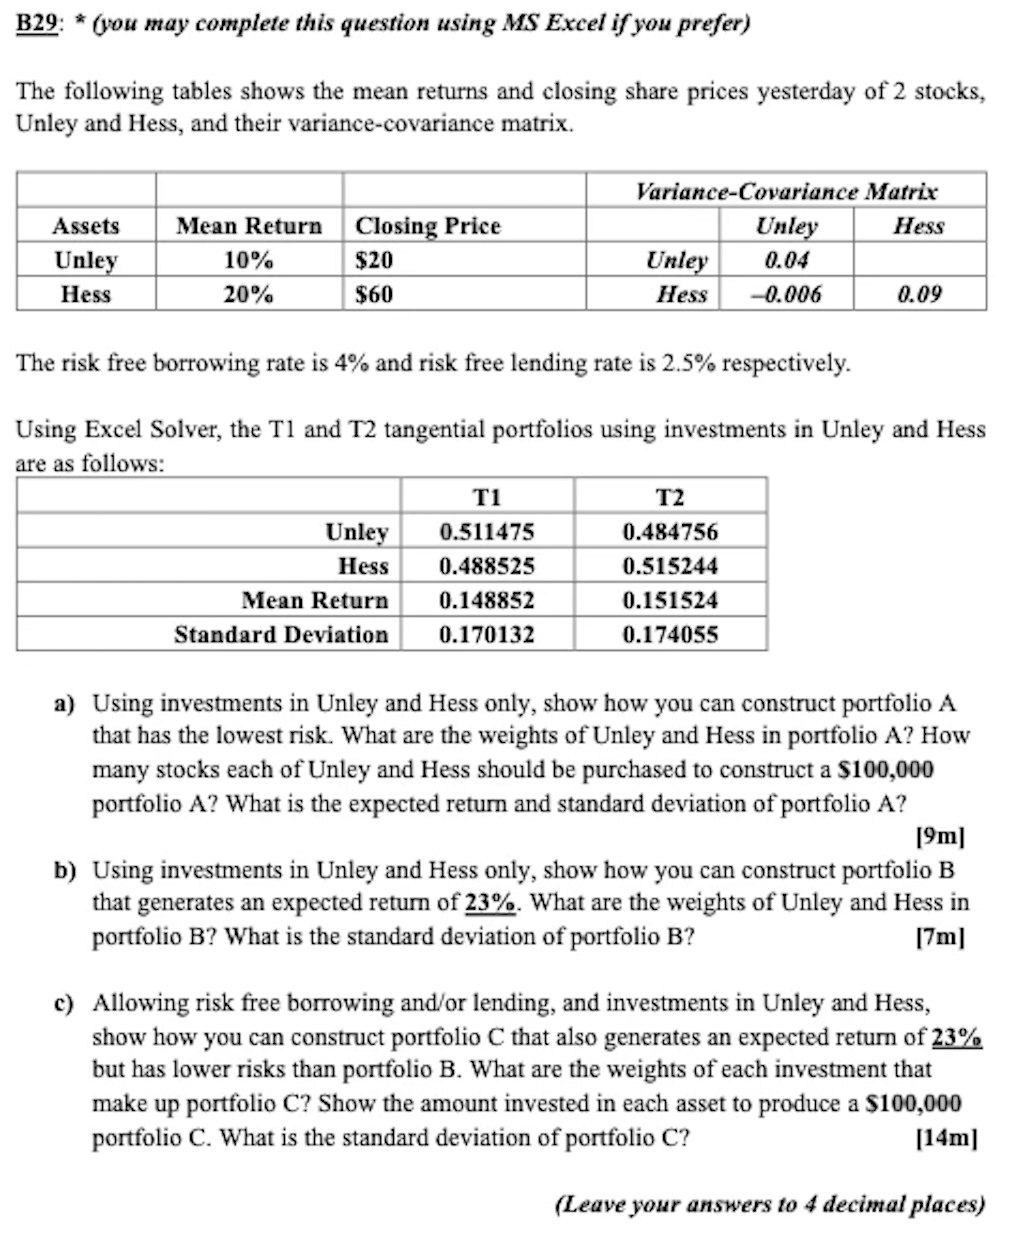
B29: * (you may complete this question using MS Excel if you prefer) The following tables shows the mean returns and closing share prices yesterday of 2 stocks, Unley and Hess, and their variance-covariance matrix. Assets Unley Hess Mean Return 10% 20% Closing Price $20 $60 Variance-Covariance Matrix Unley Hess Unley 0.04 Hess -0.006 0.09 The risk free borrowing rate is 4% and risk free lending rate is 2.5% respectively. Using Excel Solver, the TI and T2 tangential portfolios using investments in Unley and Hess are as llows: TI T2 Unley 0.511475 0.484756 Hess 0.488525 0.515244 Mean Return 0.148852 0.151524 Standard Deviation 0.170132 0.174055 a) Using investments in Unley and Hess only, show how you can construct portfolio A that has the lowest risk. What are the weights of Unley and Hess in portfolio A? How many stocks each of Unley and Hess should be purchased to construct a $100,000 portfolio A? What is the expected return and standard deviation of portfolio A? [9m] b) Using investments in Unley and Hess only, show how you can construct portfolio B that generates an expected return of 23%. What are the weights of Unley and Hess in portfolio B? What is the standard deviation of portfolio B? [7m] c) Allowing risk free borrowing and/or lending, and investments in Unley and Hess, show how you can construct portfolio C that also generates an expected return of 23% but has lower risks than portfolio B. What are the weights of each investment that make up portfolio C? Show the amount invested in each asset to produce a $100,000 portfolio C. What is the standard deviation of portfolio C? [14m] (Leave your answers to 4 decimal places)
Step by Step Solution
There are 3 Steps involved in it

Get step-by-step solutions from verified subject matter experts