

Question: < Back to Assignment Allemple: Average: 14 6. Creating Effective Graphics - Part 1 Carefully evaluate the best way to illustrate your data. Using
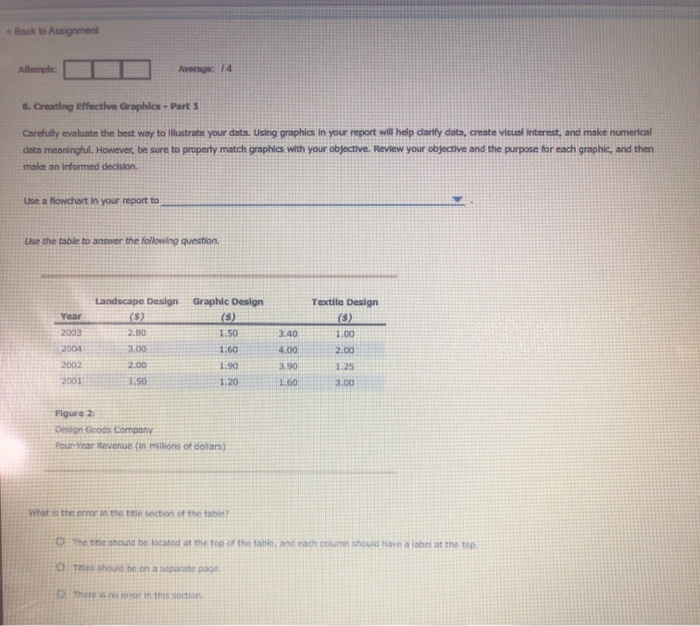
< Back to Assignment Allemple: Average: 14 6. Creating Effective Graphics - Part 1 Carefully evaluate the best way to illustrate your data. Using graphics in your report will help clarify data, create visual interest, and make numerical data meaningful. However, be sure to property match graphics with your objective. Review your objective and the purpose for each graphic, and then make an informed decision. Use a flowchart in your report to Use the table to answer the following question. Landscape Design Graphic Designi Textile Design Year (5) (5) (5) 2003 2.80 1.50 3.40 1.00 2004 3.00 1.60 4.00 2.00 2002 2.00 1.90 3.90 1.25 2001 1.50 1.20 1.60 3.00 Figure 2:1 Design Goods Company Four-Year Revenue (in millions of dollars) What is the error in the title section of the table? The title should be located at the top of the table, and each column should have a label at the top O Titles should be on a separate page. O There is no error in this section
Step by Step Solution
There are 3 Steps involved in it

Get step-by-step solutions from verified subject matter experts