

Question: Back to Assignment Attempts 4. Competitive labor market equilibrium A company operates in a perfectly competitive market, selling each unit of output for a price
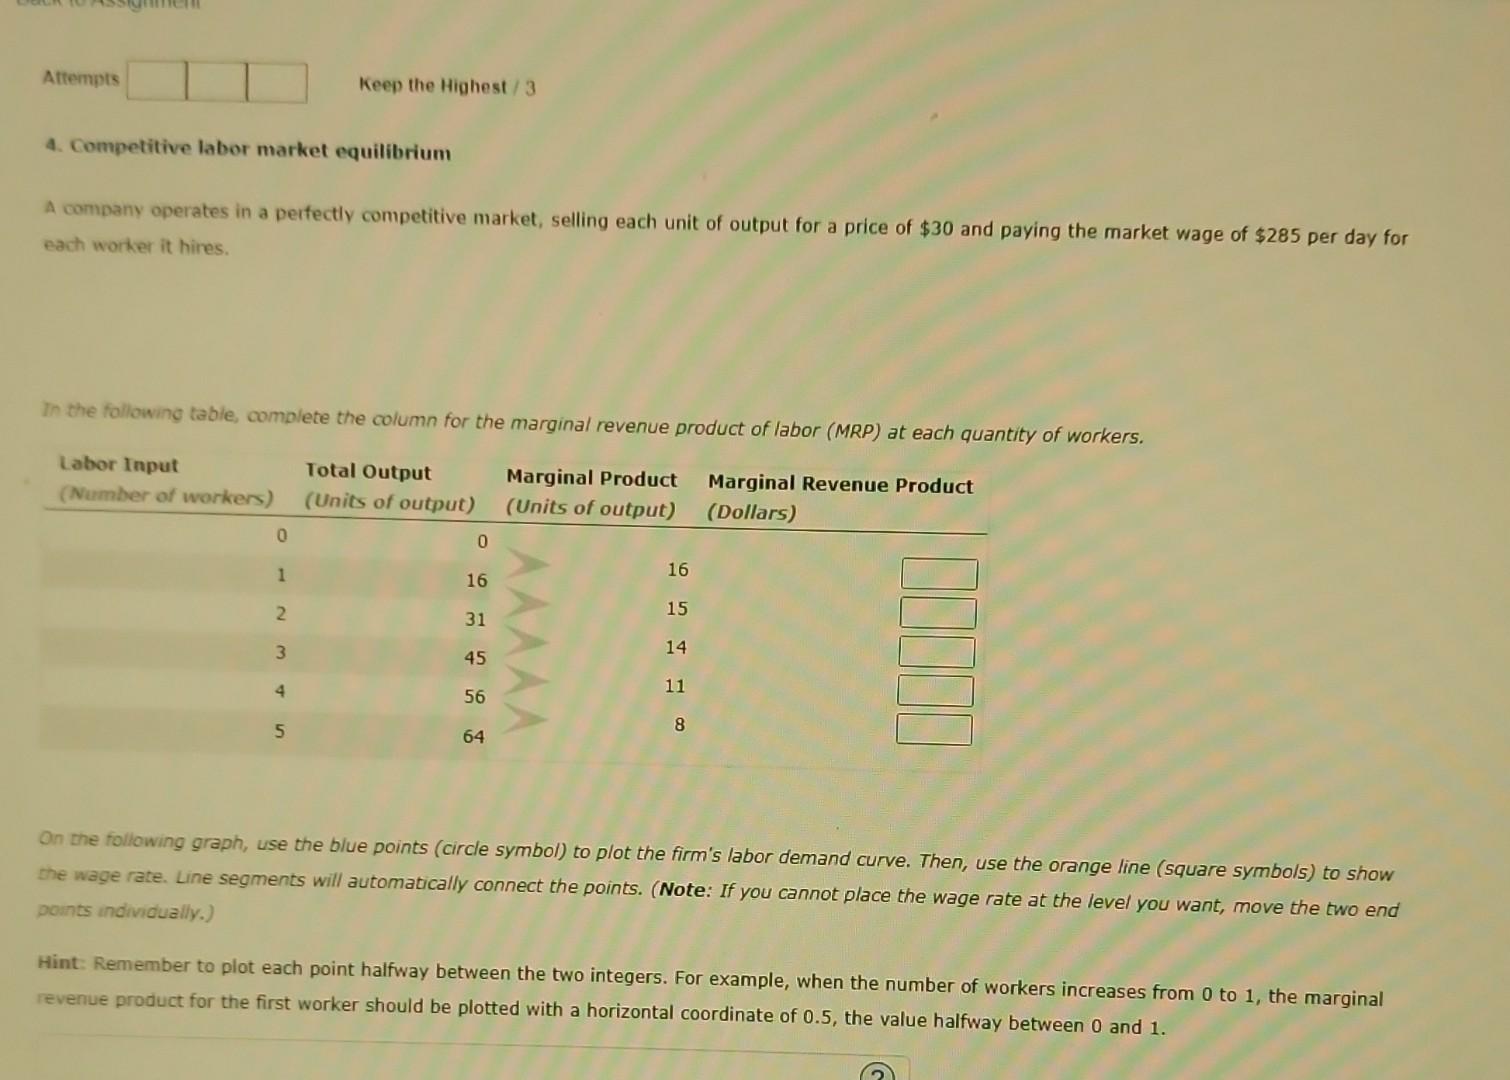
Back to Assignment Attempts 4. Competitive labor market equilibrium A company operates in a perfectly competitive market, selling each unit of output for a price of $30 and paying the market wage of $285 per day for each worker it hires. In the following table, complete the column for the marginal revenue product of labor (MRP) at each quantity of workers. Labor Input (Number of workers) Total Output (Units of output) Marginal Product (Units of output) Marginal Revenue Product (Dollars) 0 Keep the Highest/3 1 2 3 4 5 0 16 31 45 56 64 16 15 14 11 8 On the following graph, use the blue points (circle symbol) to plot the firm's labor demand curve. Then, use the orange line (square symbols) to show the wage rate. Line segments will automatically connect the points. (Note: If you cannot place the wage rate at the level you want, move the two end points individually.) Hint: Remember to plot each point halfway between the two integers. For example, when the number of workers increases from 0 to 1, the marginal revenue product for the first worker should be plotted with a horizontal coordinate of 0.5, the value halfway between 0 and 1.
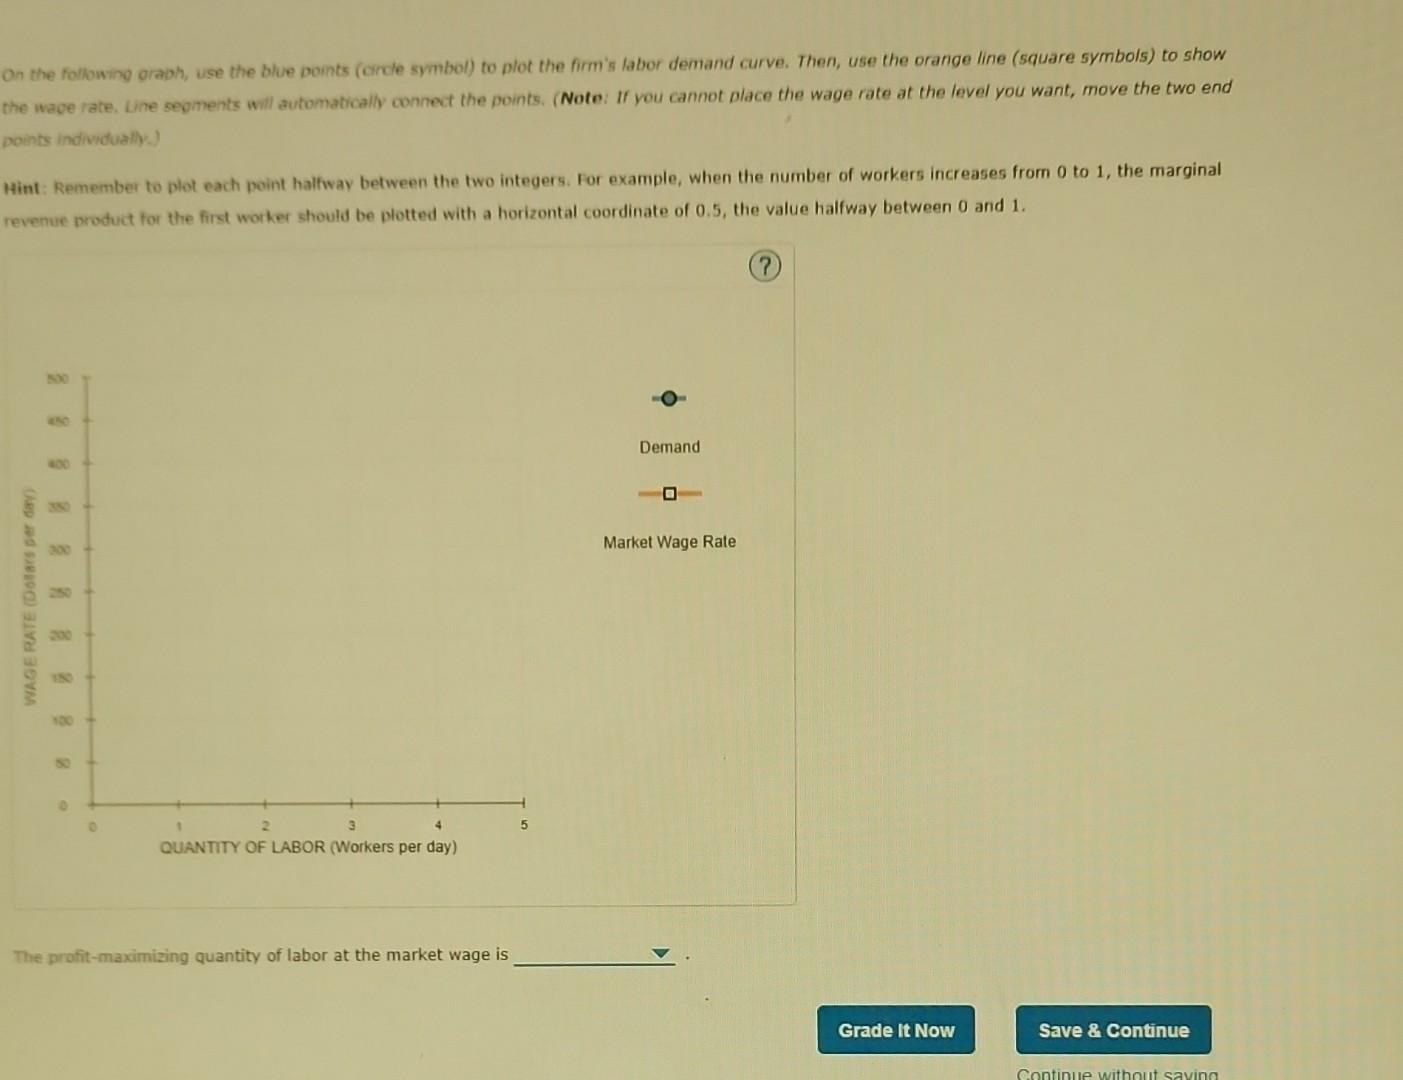
4. Competitive labor market equilibrium A company operates in a perfectly competitive market, selling each unit of output for a price of $30 and paying the market wage of $285 per day for each worker it hires. In the following table, complete the column for the marginal revenue product of labor (MRP) at each quantity of workers. On the following graph, use the blue points (circle symbol) to plot the firm's labor demand curve. Then, use the orange line (square symbols) to show the wage rate. Line segments will automatically connect the points. (Note: If you cannot place the wage rate at the level you want, move the two end points individually.) Hint: Remember to plot each point halfway between the two integers. For example, when the number of workers increases from 0 to 1 , the marginal revenue product for the first worker should be plotted with a horizontal coordinate of 0.5 , the value halfway between 0 and 1 . On the following graph, use the blue points (corcle symbol) to plot the firm's labor demand curve. Then, use the orange line (square symbols) to show the wace rate, ure seoments inil automatically connect the points. (Note: If you cannot place the wage rate at the level you want, move the two end points individually.) Aint: Remember to plot each point halfway between the two integers. For example, when the number of workers increases from 0 to 1 , the marginal revenue product for the first worker should be plotted with a horizontal coordinate of 0.5 , the value halfway between 0 and 1 . The profit-maximizing quantity of labor at the market wage is 4. Competitive labor market equilibrium A company operates in a perfectly competitive market, selling each unit of output for a price of $30 and paying the market wage of $285 per day for each worker it hires. In the following table, complete the column for the marginal revenue product of labor (MRP) at each quantity of workers. On the following graph, use the blue points (circle symbol) to plot the firm's labor demand curve. Then, use the orange line (square symbols) to show the wage rate. Line segments will automatically connect the points. (Note: If you cannot place the wage rate at the level you want, move the two end points individually.) Hint: Remember to plot each point halfway between the two integers. For example, when the number of workers increases from 0 to 1 , the marginal revenue product for the first worker should be plotted with a horizontal coordinate of 0.5 , the value halfway between 0 and 1 . On the following graph, use the blue points (corcle symbol) to plot the firm's labor demand curve. Then, use the orange line (square symbols) to show the wace rate, ure seoments inil automatically connect the points. (Note: If you cannot place the wage rate at the level you want, move the two end points individually.) Aint: Remember to plot each point halfway between the two integers. For example, when the number of workers increases from 0 to 1 , the marginal revenue product for the first worker should be plotted with a horizontal coordinate of 0.5 , the value halfway between 0 and 1 . The profit-maximizing quantity of labor at the market wage is
Step by Step Solution
There are 3 Steps involved in it

Get step-by-step solutions from verified subject matter experts