

Question: Background: Fourier transform, Double side spectra, Nyquist frequency, An audio file (chirp.wav) is given. The sampling frequency used to record this audio signal was 8192
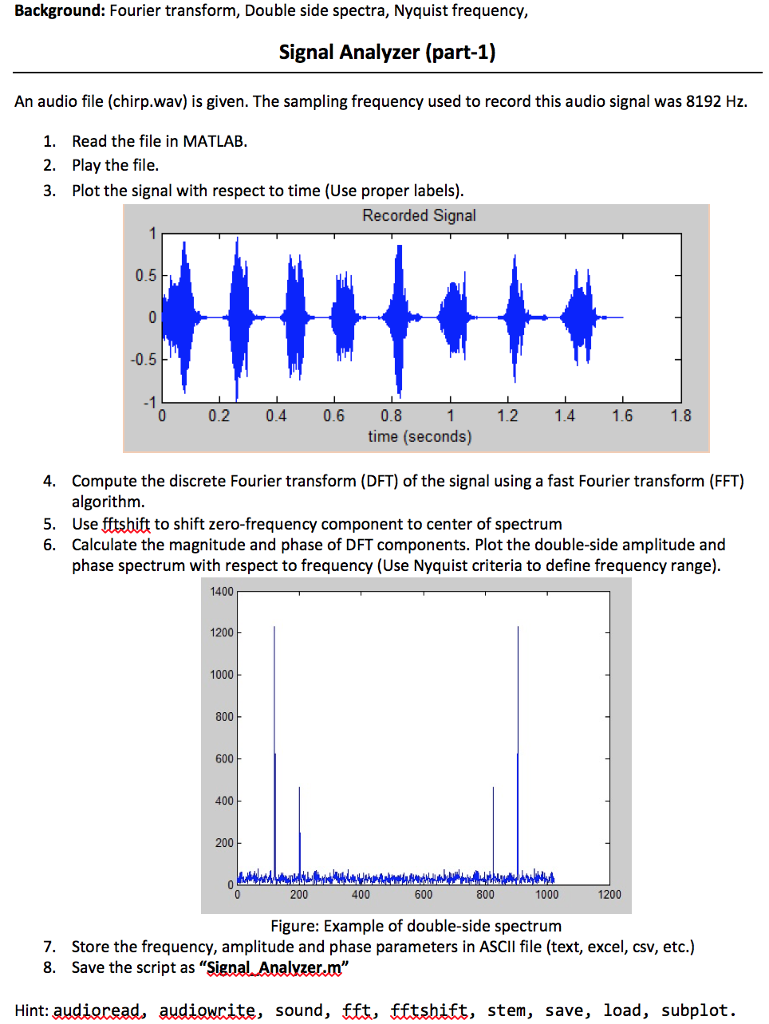
Background: Fourier transform, Double side spectra, Nyquist frequency, An audio file (chirp.wav) is given. The sampling frequency used to record this audio signal was 8192 Hz. 1. Read the file in MATLAB. 2. Play the file. 3. Plot the signal with respect to time (Use proper labels). 4. Compute the discrete Fourier transform (DFT) of the signal using a fast Fourier transform (FFT) algorithm. 5. Use fftshift to shift zero-frequency component to center of spectrum 6. Calculate the magnitude and phase of DFT components. Plot the double-side amplitude and phase spectrum with respect to frequency (Use Nyquist criteria to define frequency range). 7. Store the frequency, amplitude and phase parameters in ASCIl file (text, excel, csv, etc.) 8. Save the script as "Signal Analyzer.m
Step by Step Solution
There are 3 Steps involved in it

Get step-by-step solutions from verified subject matter experts