

Use this referral: Hole No. Par Dustins Score Martins Score 1 4 2 5 3 3 4
Fantastic news! We've Found the answer you've been seeking!
Question:
 Use this referral:
Hole No. | Par | Dustin’s Score | Martin’s Score |
1 | 4 | ||
2 | 5 | ||
3 | 3 | ||
4 | 4 | ||
5 | 3 | ||
6 | 5 | ||
7 | 5 | ||
8 | 3 | ||
9 | 4 | ||
Total Score | |||
Wins? (1=Yes) |
Transcribed Image Text:
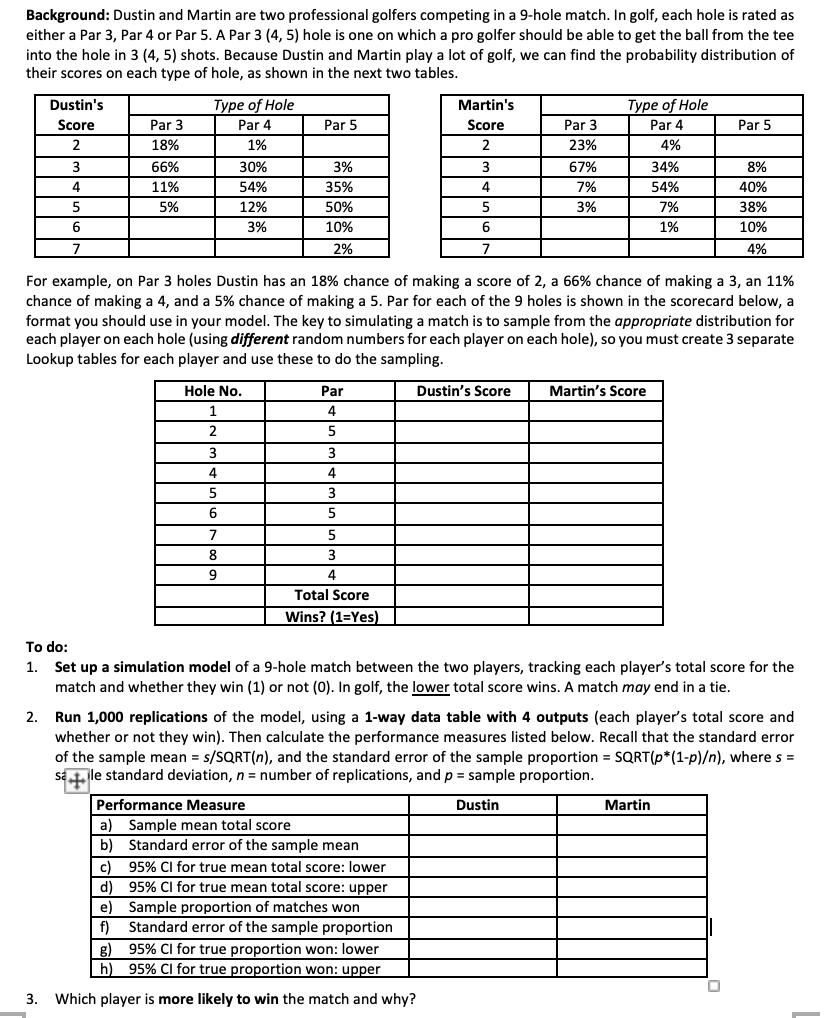
Background: Dustin and Martin are two professional golfers competing in a 9-hole match. In golf, each hole is rated as either a Par 3, Par 4 or Par 5. A Par 3 (4, 5) hole is one on which a pro golfer should be able to get the ball from the tee into the hole in 3 (4, 5) shots. Because Dustin and Martin play a lot of golf, we can find the probability distribution of their scores on each type of hole, as shown in the next two tables. Dustin's Score 2 3 4 5 6 7 Par 3 18% 66% 11% 5% 2. Type of Hole Par 4 1% Hole No. 1 2 3 4 30% 54% 12% 3% 5 6 7 8 9 Par 5 3% 35% 50% 10% 2% Par 4 5 3 4 3 5 For example, on Par 3 holes Dustin has an 18% chance of making a score of 2, a 66% chance of making a 3, an 11% chance of making a 4, and a 5% chance of making a 5. Par for each of the 9 holes is shown in the scorecard below, a format you should use in your model. The key to simulating a match is to sample from the appropriate distribution for each player on each hole (using different random numbers for each player on each hole), so you must create 3 separate Lookup tables for each player and use these to do the sampling. 5 3 4 Total Score Wins? (1-Yes) Martin's Score 2 3 4 5 6 7 Performance Measure a) Sample mean total score b) Standard error of the sample mean c) d Dustin's Score 95% CI for true mean total score: lower 95% CI for true mean total score: upper Par 3 23% 67% 7% 3% Type of Hole Par 4 4% e) Sample proportion of matches won f) Standard error of the sample proportion g) 95% CI for true proportion won: lower h) 95% CI for true proportion won: upper 3. Which player is more likely to win the match and why? Martin's Score 34% 54% To do: 1. Set up a simulation model of a 9-hole match between the two players, tracking each player's total score for the match and whether they win (1) or not (0). In golf, the lower total score wins. A match may end in a tie. 7% 1% Par 5 Run 1,000 replications of the model, using a 1-way data table with 4 outputs (each player's total score and whether or not they win). Then calculate the performance measures listed below. Recall that the standard error of the sample mean = s/SQRT(n), and the standard error of the sample proportion = SQRT (p*(1-p)/n), where s = sale standard deviation, n = number of replications, and p = sample proportion. 4+1 Dustin Martin 8% 40% 38% 10% 4% Background: Dustin and Martin are two professional golfers competing in a 9-hole match. In golf, each hole is rated as either a Par 3, Par 4 or Par 5. A Par 3 (4, 5) hole is one on which a pro golfer should be able to get the ball from the tee into the hole in 3 (4, 5) shots. Because Dustin and Martin play a lot of golf, we can find the probability distribution of their scores on each type of hole, as shown in the next two tables. Dustin's Score 2 3 4 5 6 7 Par 3 18% 66% 11% 5% 2. Type of Hole Par 4 1% Hole No. 1 2 3 4 30% 54% 12% 3% 5 6 7 8 9 Par 5 3% 35% 50% 10% 2% Par 4 5 3 4 3 5 For example, on Par 3 holes Dustin has an 18% chance of making a score of 2, a 66% chance of making a 3, an 11% chance of making a 4, and a 5% chance of making a 5. Par for each of the 9 holes is shown in the scorecard below, a format you should use in your model. The key to simulating a match is to sample from the appropriate distribution for each player on each hole (using different random numbers for each player on each hole), so you must create 3 separate Lookup tables for each player and use these to do the sampling. 5 3 4 Total Score Wins? (1-Yes) Martin's Score 2 3 4 5 6 7 Performance Measure a) Sample mean total score b) Standard error of the sample mean c) d Dustin's Score 95% CI for true mean total score: lower 95% CI for true mean total score: upper Par 3 23% 67% 7% 3% Type of Hole Par 4 4% e) Sample proportion of matches won f) Standard error of the sample proportion g) 95% CI for true proportion won: lower h) 95% CI for true proportion won: upper 3. Which player is more likely to win the match and why? Martin's Score 34% 54% To do: 1. Set up a simulation model of a 9-hole match between the two players, tracking each player's total score for the match and whether they win (1) or not (0). In golf, the lower total score wins. A match may end in a tie. 7% 1% Par 5 Run 1,000 replications of the model, using a 1-way data table with 4 outputs (each player's total score and whether or not they win). Then calculate the performance measures listed below. Recall that the standard error of the sample mean = s/SQRT(n), and the standard error of the sample proportion = SQRT (p*(1-p)/n), where s = sale standard deviation, n = number of replications, and p = sample proportion. 4+1 Dustin Martin 8% 40% 38% 10% 4%
Expert Answer:

Related Book For 

Microeconomics
ISBN: 9781464146978
1st Edition
Authors: Austan Goolsbee, Steven Levitt, Chad Syverson
Posted Date:
Students also viewed these mathematics questions
-
Managing Scope Changes Case Study Scope changes on a project can occur regardless of how well the project is planned or executed. Scope changes can be the result of something that was omitted during...
-
Extend Your enjoyment Welcome to Cunningham Gudgal Golf Resort Background Information Cunningham Holdings Limited is a diversified family owned business. For more information about the company see...
-
Extend Your enjoyment Welcome to Cunningham Gudgal Golf Resort Background Information Cunningham Holdings Limited is a diversified family owned business. For more information about the company see...
-
Solve for y' y' = y = 71-x 3
-
Which of the following sampling risks does the audit team control in an attributes sampling application (ROO 5 risk of overreliance, ROU 5 risk ofunderreliance)? R00 Yes No Yes No ROU Yes es No No
-
__________ is the element of a system that needed to be designed. (a) Input (b) Output (c) Interface (d) Input, output, and interface
-
The chilled-water plant at the University of Pennsylvania sends chilled water to the buildings at \(42^{\circ} \mathrm{F}\) and receives warmed water at \(55^{\circ} \mathrm{F}\). A refrigerant is...
-
Handyman Services was founded on January 1 and entered into the following transactions during January: 1. Issued common stock of $30,000 in exchange for cash. 2. Purchased an old warehouse for...
-
How do you think a risk manager might work through a difference of opinion with a unit manager? Explain in details.
-
Natalie had a very busy December. At the end of the month, after journalizing and posting the December transactions and adjusting entries, Natalie prepared the following adjusted trial balance....
-
There are three stocks: A, B, and C. You can either invest in these stocks or short sell them. There are three possible states of nature for economic growth in the upcoming year (each equally likely...
-
Dogslike many animalsstand and walk on their toes. A photo of the rear foot of a dog is shown in Figure P8.50a; Figure P8.50b shows the bones of the leg and foot along with relevant distances. The...
-
Two species of foxes are shown here. One is a kit fox in Arizona. The other is an Arctic fox. Which is which? How can you tell? Describe at least two traits that make each animal well adapted to its...
-
A sequence is given: YN Y YN Y Y YN N N N N N N N Y Y (a) Identify the values of n, \(n_{1}, n_{2}\), and \(r\). (b) Determine the critical values at the \(\alpha=0.05\) level of significance. (c)...
-
For each of the situations below, identify a potential source of analogy data for the costs under each of the following cases: (1) this project/activity is a first of its kind for the company, and...
-
The CPI-U (U.S. city average, all items) has the following annual averages: a. For each year from 2007 to 2010, determine the annual inflation rate in percent to three decimal places. b. Since...
-
The City by the Bay Chocolate Company makes world-class chocolate. They are preparing their Finished Goods Inventory Budget for next year. Each box of chocolate they make has the following costs:...
-
Subtract the polynomials. (-x+x-5) - (x-x + 5)
-
Each day, you and a friend play odds/evens to see who gets the last doughnut. On command, you each extend either one or two fingers. If the sum of the fingers is odd, you get the doughnut. If the sum...
-
At a price of $3 each, Yoshi (a typical New Yorker) drinks 200 44 oz. sodas each year. Concerned about burgeoning obesity, the Mayor of New York proposes a $0.50 tax on on such drinks. He then...
-
A firm has a production function given by Q = 10K0.25L0.25. Suppose that each unit of capital costs R and each unit of labor costs W. a. Derive the long-run demands for capital and labor. b. Derive...
-
Solve Example 7.5 with equilibrium energy as the initial condition for the Oxygen molecule at 1 atmosphere and \(3200 \mathrm{~K}\). Example 7.5 Obtain the time dependent expression for the vibration...
-
Obtain a pseudo tri-diagonal matrix equation to solve the vorticity transport equation in a boundary layer with forward differencing in time and with appropriate differencing in space suitable for...
-
If the waverider of the Problem 7.44 has the wall temperature of \(1400 \mathrm{~K}\) and \(\operatorname{Re}=1.371 \times 10^{6}\) with respect to its length then find the drag coefficient with...

Study smarter with the SolutionInn App