

Question: Background Netflix has become an online video streaming platform categorized by high loyalty for its original content such as Stranger Things and The Great British
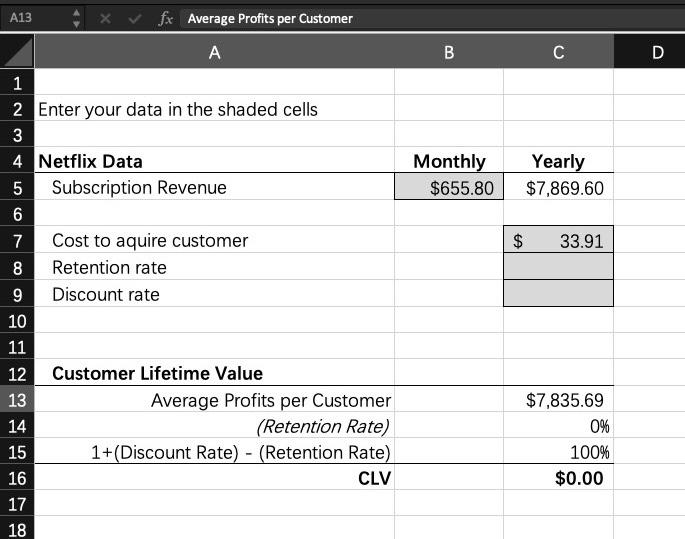
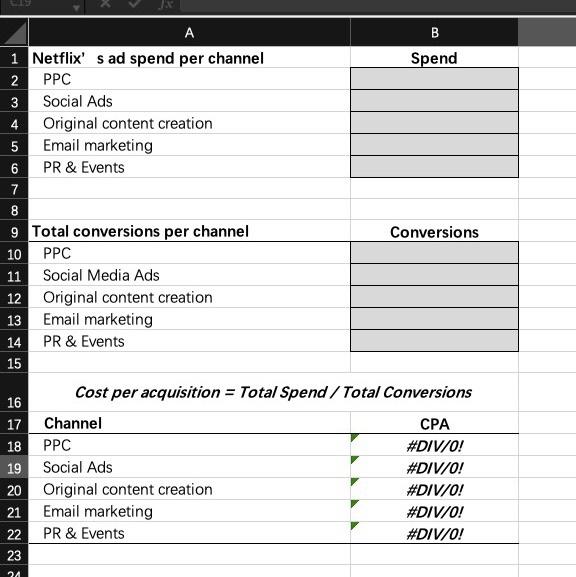
A13 ^fx Average Profits per Customer A B C D Enter your data in the shaded cells \begin{tabular}{|c|r|c|} \hline Netflix Data & \multicolumn{1}{|c|}{ Monthly } & Yearly \\ \hline Subscription Revenue & $655.80 & $7,869.60 \\ \cline { 2 - 3 } & & \end{tabular} Cost to aquire customer Retention rate Discount rate \begin{tabular}{|l|} \hline$33.91 \\ \hline \end{tabular} Customer Lifetime Value \begin{tabular}{r|r} \hline Average Profits per Customer & $7,835.69 \\ \hline (Retention Rate) & 0% \\ \hline 1+( Discount Rate) - (Retention Rate) & 100% \\ \hline CLV & $0.00 \end{tabular} \begin{tabular}{|c|l|c|} \hline & \multicolumn{1}{|c|}{ A } & \multicolumn{1}{c|}{ B } \\ \hline 1 & Netflix' s ad spend per channel & Spend \\ \hline 2 & PPC & \\ \hline 3 & Social Ads & \\ \hline 4 & Original content creation & \\ \hline 5 & Email marketing & \\ \hline 6 & PR \& Events & \\ \hline 7 & & \\ \hline 8 & & \\ \hline 9 & Total conversions per channel & \\ \hline 10 & PPC & \\ \hline 11 & Social Media Ads & \\ \hline 12 & Original content creation & \\ \hline 13 & Email marketing & \\ \hline 14 & PR \& Events & \\ \hline 15 & & \#DIV/O! \\ \hline 16 & Cost per acquisition = Total Spend / Total Conversions \\ \hline 17 & Channel & \\ \hline 18 & PPC & \#DIV/O! \\ \hline 19 & Social Ads & \\ \hline 20 & Original content creation & \\ \hline 21 & Email marketing & \\ \hline 22 & PR \& Events & \\ \hline \end{tabular} A13 ^fx Average Profits per Customer A B C D Enter your data in the shaded cells \begin{tabular}{|c|r|c|} \hline Netflix Data & \multicolumn{1}{|c|}{ Monthly } & Yearly \\ \hline Subscription Revenue & $655.80 & $7,869.60 \\ \cline { 2 - 3 } & & \end{tabular} Cost to aquire customer Retention rate Discount rate \begin{tabular}{|l|} \hline$33.91 \\ \hline \end{tabular} Customer Lifetime Value \begin{tabular}{r|r} \hline Average Profits per Customer & $7,835.69 \\ \hline (Retention Rate) & 0% \\ \hline 1+( Discount Rate) - (Retention Rate) & 100% \\ \hline CLV & $0.00 \end{tabular} \begin{tabular}{|c|l|c|} \hline & \multicolumn{1}{|c|}{ A } & \multicolumn{1}{c|}{ B } \\ \hline 1 & Netflix' s ad spend per channel & Spend \\ \hline 2 & PPC & \\ \hline 3 & Social Ads & \\ \hline 4 & Original content creation & \\ \hline 5 & Email marketing & \\ \hline 6 & PR \& Events & \\ \hline 7 & & \\ \hline 8 & & \\ \hline 9 & Total conversions per channel & \\ \hline 10 & PPC & \\ \hline 11 & Social Media Ads & \\ \hline 12 & Original content creation & \\ \hline 13 & Email marketing & \\ \hline 14 & PR \& Events & \\ \hline 15 & & \#DIV/O! \\ \hline 16 & Cost per acquisition = Total Spend / Total Conversions \\ \hline 17 & Channel & \\ \hline 18 & PPC & \#DIV/O! \\ \hline 19 & Social Ads & \\ \hline 20 & Original content creation & \\ \hline 21 & Email marketing & \\ \hline 22 & PR \& Events & \\ \hline \end{tabular}
Step by Step Solution
There are 3 Steps involved in it

Get step-by-step solutions from verified subject matter experts