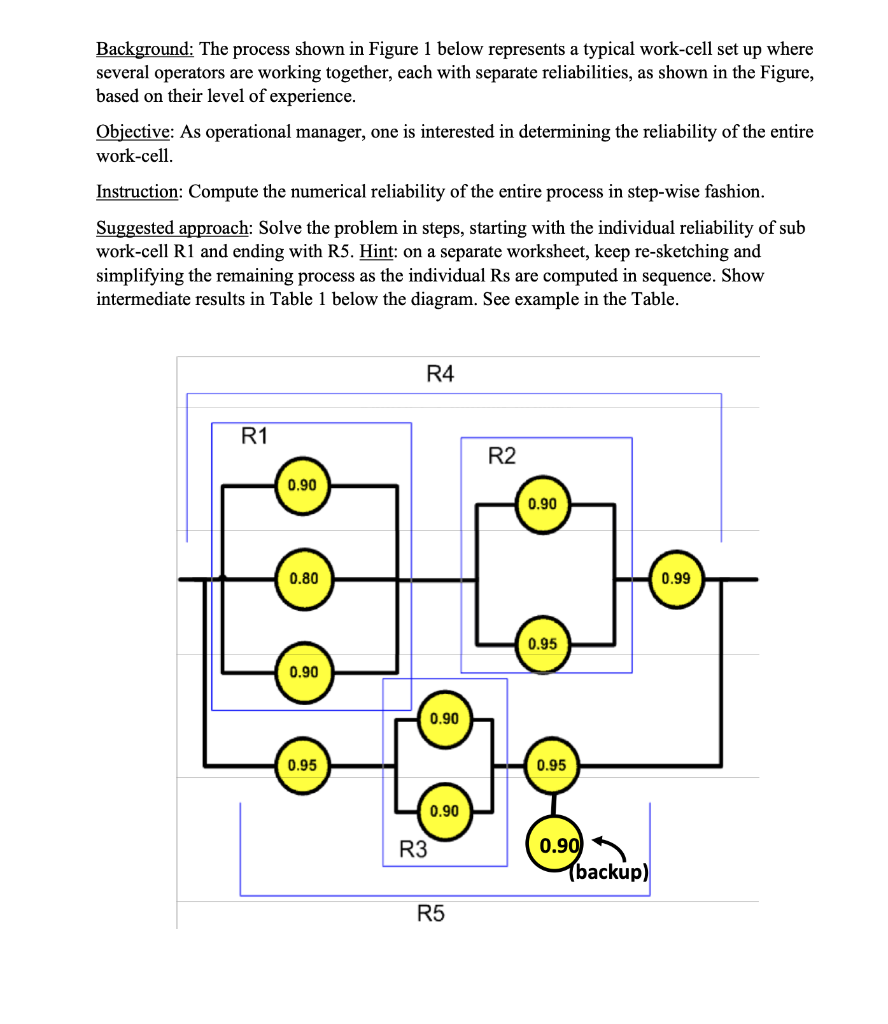
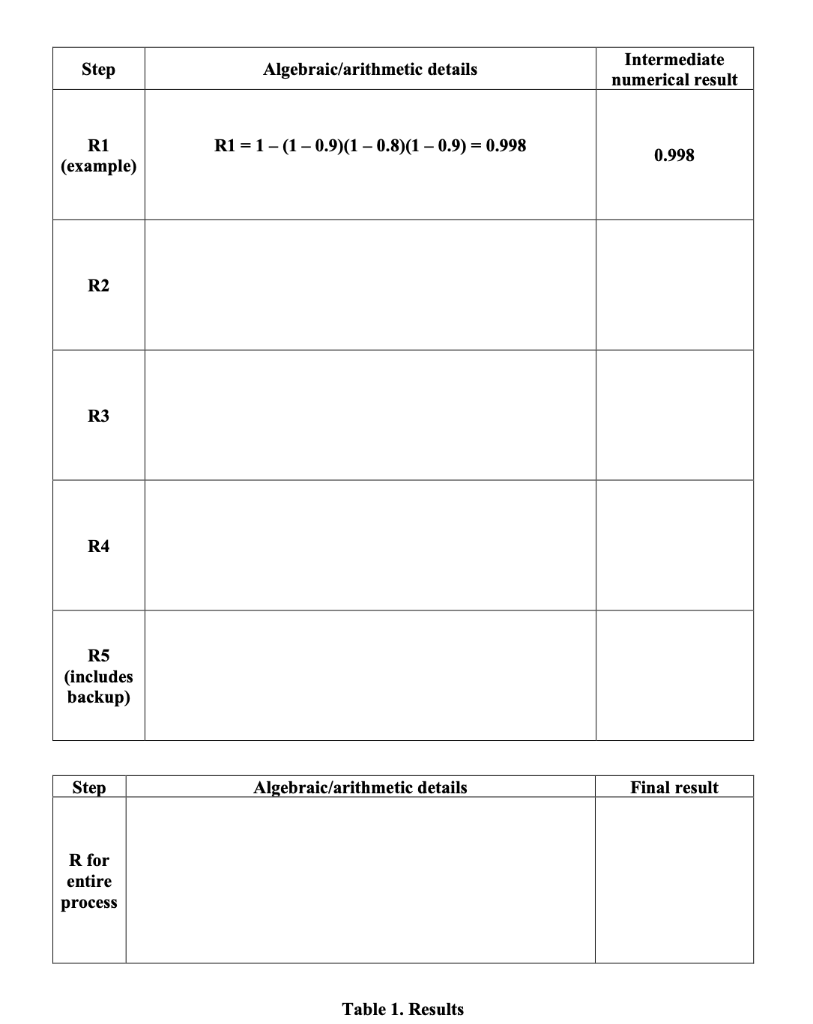
Question: Background: The process shown in Figure 1 below represents a typical work-cell set up where several operators are working together, each with separate reliabilities, as

Background: The process shown in Figure 1 belowBackground: The process shown in Figure 1 below

Background: The process shown in Figure 1 below represents a typical work-cell set up where several operators are working together, each with separate reliabilities, as shown in the Figure, based on their level of experience. Objective: As operational manager, one is interested in determining the reliability of the entire work-cell. Instruction: Compute the numerical reliability of the entire process in step-wise fashion. Suggested approach: Solve the problem in steps, starting with the individual reliability of sub work-cell R1 and ending with R5. Hint: on a separate worksheet, keep re-sketching and simplifying the remaining process as the individual Rs are computed in sequence. Show intermediate results in Table 1 below the diagram. See example in the Table. R4 R1 R2 0.90 0.90 0.80 0.99 0.95 0.90 0.90 0.95 0.95 0.90 R3 0.90 (backup) R5 Step Algebraic/arithmetic details Intermediate numerical result R1 = 1- (1 - 0.9)(1 0.8)(1 -0.9) = 0.998 R1 (example) 0.998 R2 R3 R4 R5 (includes backup) Step Algebraic/arithmetic details Final result R for entire process Table 1. Results

Step by Step Solution

There are 3 Steps involved in it

1 Expert Approved Answer
Step: 1 Unlock blur-text-image
Question Has Been Solved by an Expert!

Get step-by-step solutions from verified subject matter experts

Step: 2 Unlock
Step: 3 Unlock

Students Have Also Explored These Related General Management Questions!