

Question: Bad Drivers The data on the BadDriversData worksheet displays the percentage of drivers involved in fatal collisions by state. Use the BadDriversData worksheet as the
Bad Drivers
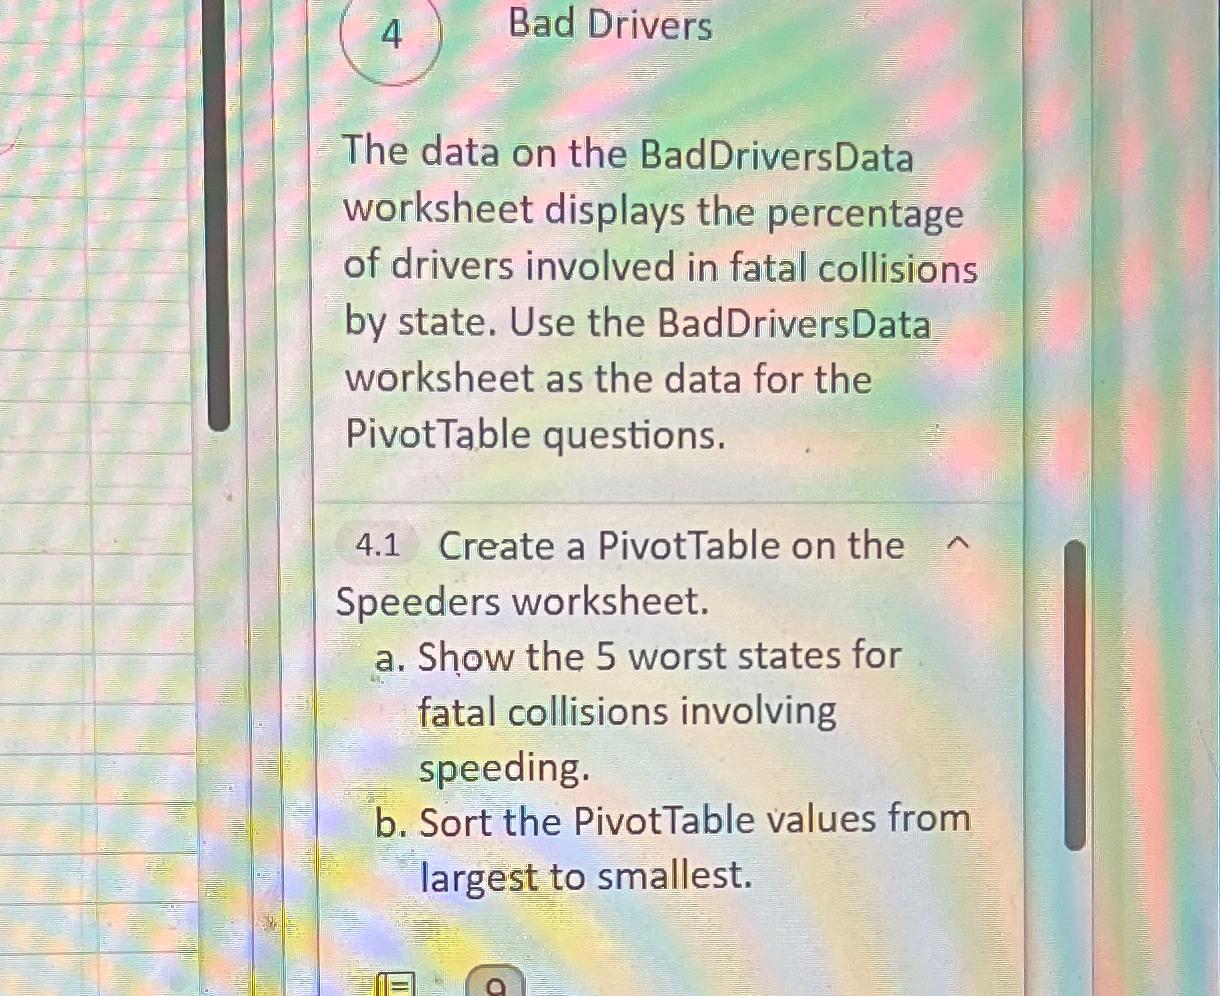
The data on the BadDriversData worksheet displays the percentage of drivers involved in fatal collisions by state. Use the BadDriversData worksheet as the data for the PivotTable questions.
Create a PivotTable on the Speeders worksheet.
a Show the worst states for fatal collisions involving speeding.
b Sort the PivotTable values from largest to smallest.
Step by Step Solution
There are 3 Steps involved in it
1 Expert Approved Answer
Step: 1 Unlock

Question Has Been Solved by an Expert!
Get step-by-step solutions from verified subject matter experts
Step: 2 Unlock
Step: 3 Unlock