

Question: BADB1014 QUANTITATIVE METHODS 1. The table below contains the data for time, in seconds, to answer 50 incoming calls to a financial services call centre.
BADB1014 QUANTITATIVE METHODS

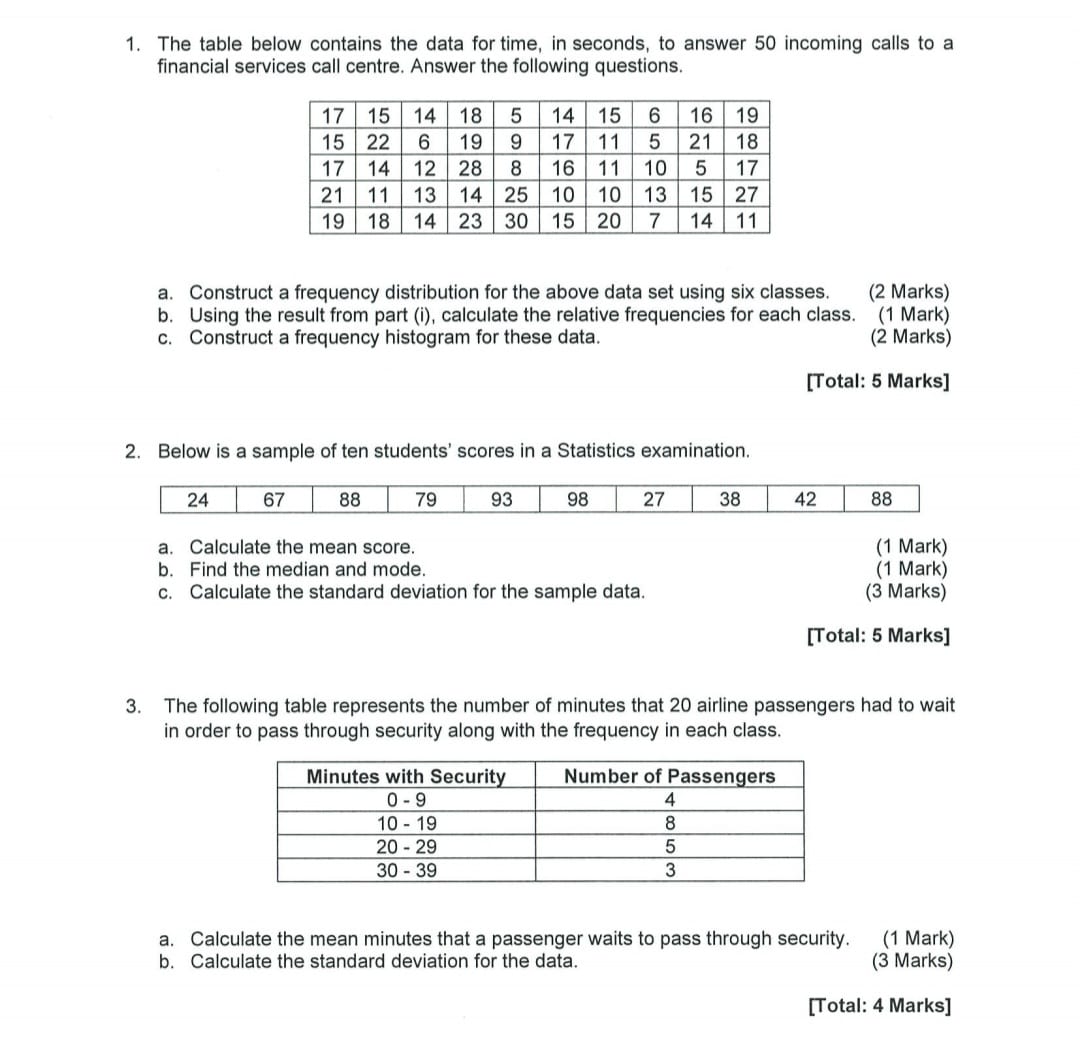
1. The table below contains the data for time, in seconds, to answer 50 incoming calls to a financial services call centre. Answer the following questions. 17 15 14 18 5 14 15 6 16 19 15 22 6 |19 9 17 11 5 21 18 17 14 12 28 8 16 11 10 5 17 21 11 13 14 25 10 10 13 15 27 19 18 14 23 30 15 20 7 14 11 a. Construct a frequency distribution for the above data set using six classes. (2 Marks) b. Using the result from part (i), calculate the relative frequencies for each class. (1 Mark) c. Construct a frequency histogram for these data. (2 Marks) [Total: 5 Marks] 2. Below is a sample of ten students' scores in a Statistics examination. 24 67 88 79 93 98 27 38 42 88 a. Calculate the mean score. (1 Mark) 6. Find the median and mode. (1 Mark) c. Calculate the standard deviation for the sample data. (3 Marks) [Total: 5 Marks] 3. The following table represents the number of minutes that 20 airline passengers had to wait in order to pass through security along with the frequency in each class. Minutes with Security Number of Passengers 0 - 9 10 - 19 20 - 29 30 - 39 a. Calculate the mean minutes that a passenger waits to pass through security. (1 Mark) b. Calculate the standard deviation for the data. (3 Marks) [Total: 4 Marks]
Step by Step Solution
There are 3 Steps involved in it

Get step-by-step solutions from verified subject matter experts