

Question: Balance Sheet 12/31/2019 3. Current Ratio Horizontal Analysis 2018 Difference % 4. Inventory Turnover 5. Accounts Receivable Turnover 20,000 14,000 20,000 78,000 (24,000) 108,000 6.
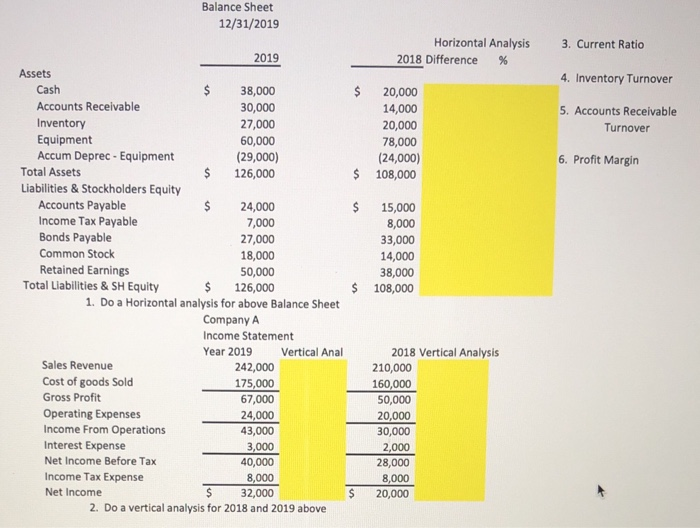
Balance Sheet 12/31/2019 3. Current Ratio Horizontal Analysis 2018 Difference % 4. Inventory Turnover 5. Accounts Receivable Turnover 20,000 14,000 20,000 78,000 (24,000) 108,000 6. Profit Margin $ 2019 Assets Cash 38,000 Accounts Receivable 30,000 Inventory 27,000 Equipment 60,000 Accum Deprec - Equipment (29,000) Total Assets 126,000 Liabilities & Stockholders Equity Accounts Payable 24,000 Income Tax Payable 7,000 Bonds Payable 27,000 Common Stock 18,000 Retained Earnings 50,000 Total Liabilities & SH Equity $ 126,000 1. Do a Horizontal analysis for above Balance Sheet Company A Income Statement Year 2019 Vertical Anal Sales Revenue 242,000 Cost of goods Sold 175,000 Gross Profit 67,000 Operating Expenses 24,000 Income From Operations 43,000 Interest Expense 3,000 Net Income Before Tax 40,000 Income Tax Expense 8,000 Net Income 32,000 2. Do a vertical analysis for 2018 and 2019 above 15,000 8,000 33,000 14,000 38,000 108,000 $ 2018 Vertical Analysis 210,000 160,000 50,000 20,000 30,000 2,000 28,000 8,000 20,000
Step by Step Solution
There are 3 Steps involved in it

Get step-by-step solutions from verified subject matter experts