

Question: Excel File Edit View Insert Format Tools Data Window Help Acctg 16 Chap 13 hw Home Insert Review = = Page Layout Formulas Data Callbel
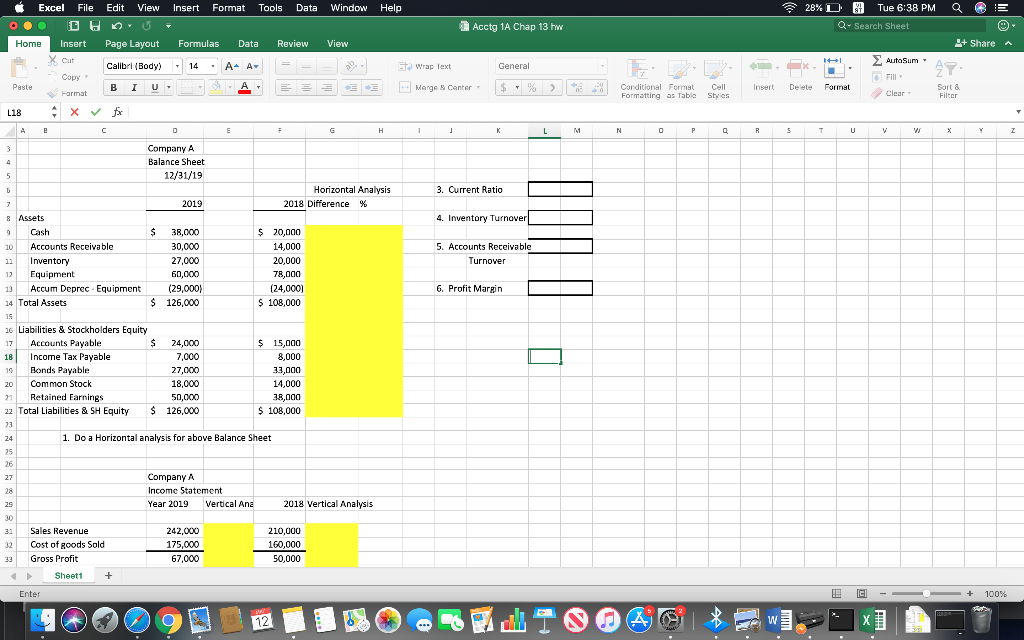
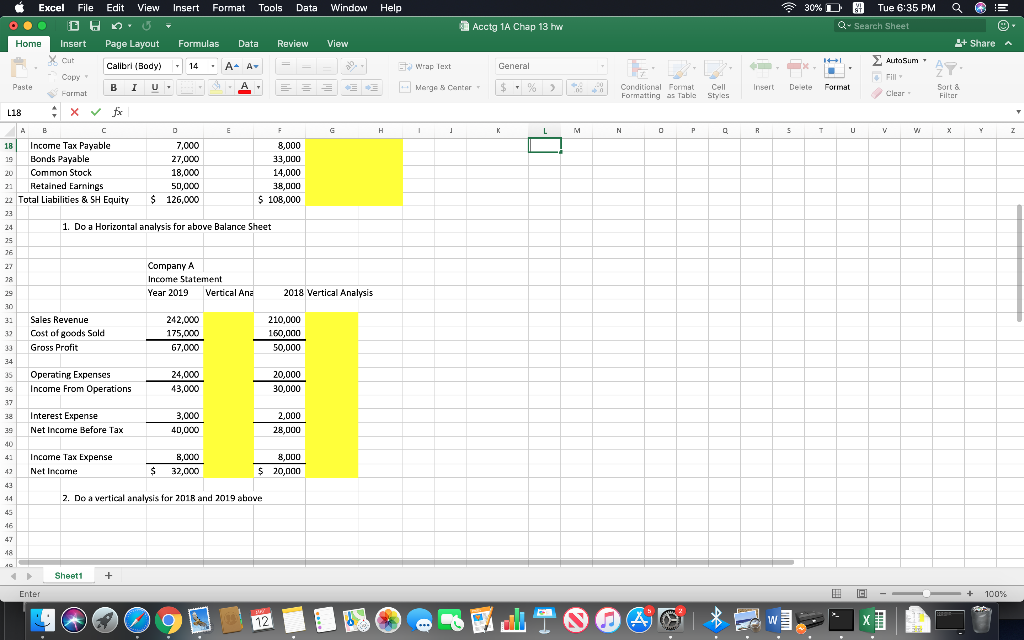
Excel File Edit View Insert Format Tools Data Window Help Acctg 16 Chap 13 hw Home Insert Review = = Page Layout Formulas Data Callbel (Body) - 14 . A- A B i U S A fx View = 0 E 28% D @ Tue 6:38 PM Q E Q-Search Sheet 1+ Share X. . AutoSum1 47. Delete Format Sort & . Wrap Text Marge Center - General $ % z ) Conditional Format Formatting as Table Cell Styles Insert clear Paste L18 Farmat * Filter Company A Balance Sheet 12/31/19 3. Current Ratio Horizontal Analysis 2018 Difference % 2019 4. Inventory Turnover $ Assets Cash 10 Accounts Receivable 11 Inventory 12 Equipment 13 Accum Deprec - Equipment 14 Total Assets 5. Accounts Receivable Turnover 38,000 30,000 27,000 60,000 (29,000) 126,000 $ 20,000 14,000 20,000 78,000 (24,000) $ 108,000 6. Profit Margin $ $ 16 Liabilities & Stockholders Equity 17 Accounts Payable 18 Income Tax Payable 10 Bonds Payable Common Stock 21 Retained Earnings 22 Total Liabilities & SH Equity 24,000 7,000 27,000 18,000 $ 15,000 8,000 33,000 14,000 38,000 $ 108,000 $ 126,000 1. Do a Horizontal analysis for above Balance Sheet Company A Income Statement Year 2019 Vertical Ana 2018 Vertical Analysis 31 Sales 32 32 Sales Revenue Cost of goods Sold Gross Profit Sheet1 +. 242,000 175,000 67,000 210,000 160,000 50,000 Enter CI - 100% Excel File Edit View Insert Format Tools Data Window Help E 30% D @ Tue 6:35 PM Q Q- Search Sheet Acctg 16 Chap 13 hw Review View 1+ Share Auta Sum Formulas Data - 14 . A A- S A - Home Insert Page Layout Xcut Calibrl (Body) - Copy Paste Format BI U L18 x fix . 2 Wrap lext Marge Canter General $ % = 3 Conditional Format Formatting as Table Cell Styles Insert Delete Format Sort & clear Filter 18 Income Tax Payable 19 Bonds Payable 20 Common Stock 21 Retained Earnings 22 Total Liabilities & SH Equity 7,000 27,000 18,000 50,000 126,000 8,000 33,000 14,000 38,000 $ 108,000 $ 1. Do a Horizontal analysis for above Balance Sheet Company A Income Statement Year 2019 Vertical Ana 2018 Vertical Analysis Sales Revenue Cost of goods Sold Gross Profit 242,000 175,000 67,000 210,000 160,000 50,000 33 Operating Expenses Income From Operations 24,000 43,000 20,000 30,000 2,000 Interest Expense Net Income Before Tax 3,000 40,000 28,000 Income Tax Expense Net Income 3.000 32,000 8,000 20,000 $ 2. Do a vertical analysis for 2018 and 2019 above Sheet1 + Enter CI 100%
Step by Step Solution
There are 3 Steps involved in it

Get step-by-step solutions from verified subject matter experts