

Question: Balance Sheet December 31 2016 () 2017 () 2.000 2,000 2,000 20.000 4,000 30,000 4,500 6,500 5,000 35,000 5.000 56,000 Assets Cash Accounts receivable (net)
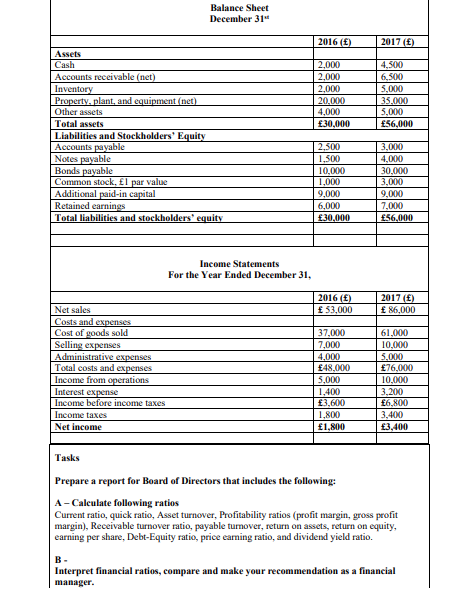
Balance Sheet December 31 2016 () 2017 () 2.000 2,000 2,000 20.000 4,000 30,000 4,500 6,500 5,000 35,000 5.000 56,000 Assets Cash Accounts receivable (net) Inventory Property, plant, and equipment (net) Other assets Total assets Liabilities and Stockholders' Equity Accounts payable Notes payable Bonds payable Common stock, l par value Additional paid-in capital Retained earnings Total liabilities and stockholders' equity 2,500 1,500 10,000 1,000 9,000 6,000 30.000 3,000 4,000 30,000 3,000 9,000 7,000 56.000 Income Statements For the Year Ended December 31, 2016 () 53,000 2017 (8) 86,000 Net sales Costs and expenses Cost of goods sold Selling expenses Administrative expenses Total costs and expenses Income from operations Interest expense Income before income taxes Income taxes Net income 37,000 7,000 4.000 48,000 5,000 1,400 3,600 1,800 1,800 61,000 10,000 5.000 76,000 10.000 3,200 6,800 3,400 3,400 Tasks Prepare a report for Board of Directors that includes the following: A-Calculate following ratios Current ratio, quick ratio, Asset turnover, Profitability ratios (profit margin, gross profit margin), Receivable turnover ratio, payable turnover, return on assets, return on equity, earning per share, Debt-Equity ratio, price earning ratio, and dividend yield ratio. B- Interpret financial ratios, compare and make your recommendation as a financial manager
Step by Step Solution
There are 3 Steps involved in it

Get step-by-step solutions from verified subject matter experts