

Question: Balance Sheet Ratio Homework Below, find 2018 financial data for several companies. 833 Lowe's Co 71,309 48,401 4,018 652 2,314 729 Nielsen 6,515 2,805 (475)
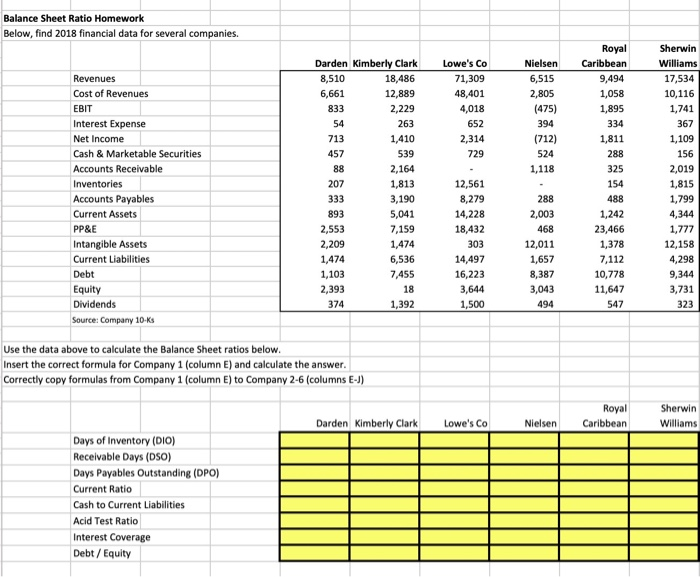
Balance Sheet Ratio Homework Below, find 2018 financial data for several companies. 833 Lowe's Co 71,309 48,401 4,018 652 2,314 729 Nielsen 6,515 2,805 (475) 394 (712) 524 1,118 Revenues Cost of Revenues EBIT Interest Expense Net Income Cash & Marketable Securities Accounts Receivable Inventories Accounts Payables Current Assets PP&E Intangible Assets Current Liabilities Debt Equity Dividends Source: Company 10 ks Darden Kimberly Clark 8,510 18,486 6,661 12,889 2,229 54 263 713 1,410 457 539 88 2,164 207 1,813 333 3,190 893 5,041 2,553 7,159 2,209 1,474 1,474 6,536 1,103 7,455 2,393 18 374 1,392 Royal Caribbean 9,494 1,058 1,895 334 1,811 288 325 154 488 1,242 23,466 1,378 7,112 10,778 11,647 547 Sherwin Williams 17,534 10,116 1,741 367 1,109 156 2,019 1,815 1,799 4,344 1,777 12,158 4,298 9,344 3,731 323 12,561 8,279 14,228 18,432 303 14,497 16,223 3,644 1,500 288 2,003 468 12,011 1,657 8,387 3,043 494 Use the data above to calculate the Balance Sheet ratios below. Insert the correct formula for Company 1 column E) and calculate the answer. Correctly copy formulas from Company 1 column E) to Company 2-6 (columns E-J) Royal Caribbean Sherwin Williams Darden Kimberly Clark Lowe's Co Nielsen Days of Inventory (DIO) Receivable Days (DSO) Days Payables Outstanding (DPO) Current Ratio Cash to Current Liabilities Acid Test Ratio Interest Coverage Debt / Equity
Step by Step Solution
There are 3 Steps involved in it

Get step-by-step solutions from verified subject matter experts