Question: Balance Sheet v [ show Faotnotes |A5 Reported Currency V| |As Reported Scale v ' Refresh Exchange rate used is that of the Year End
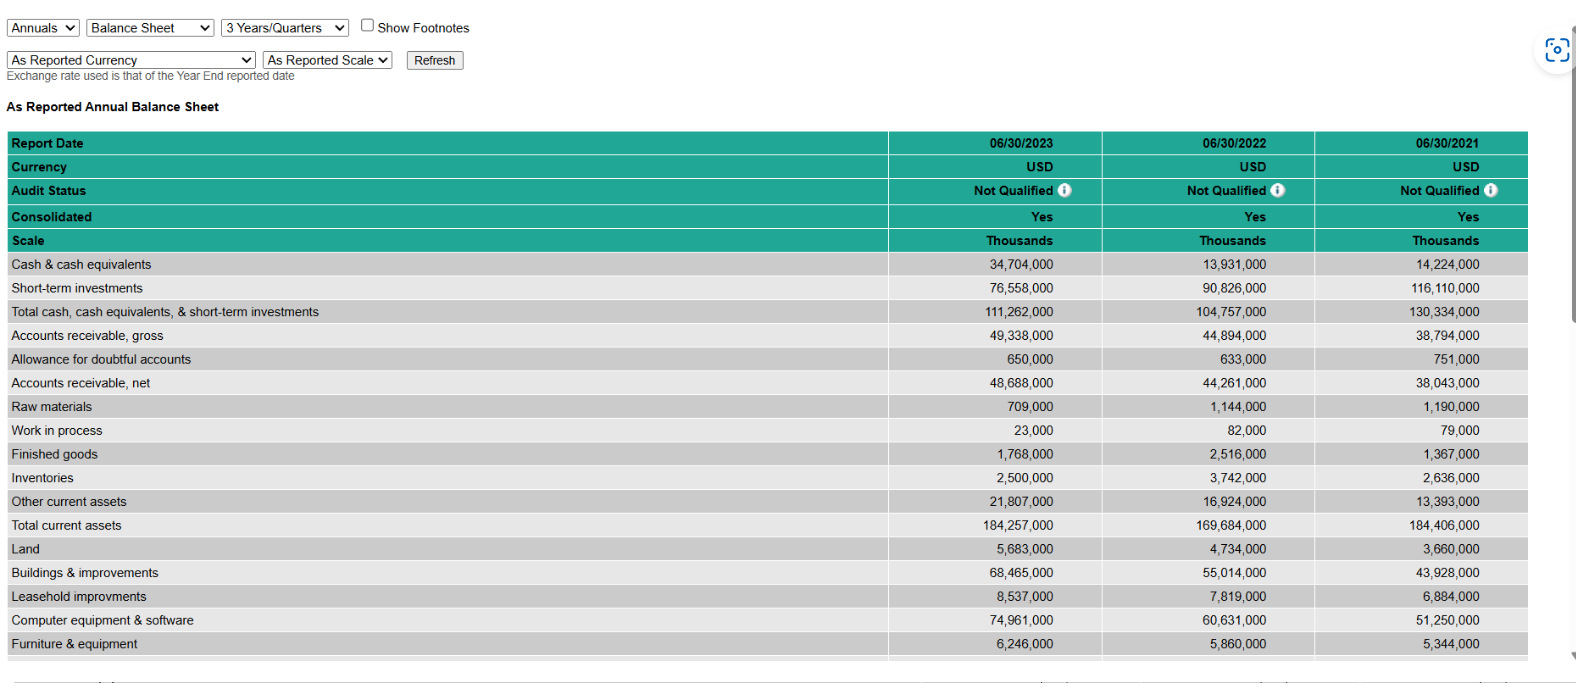
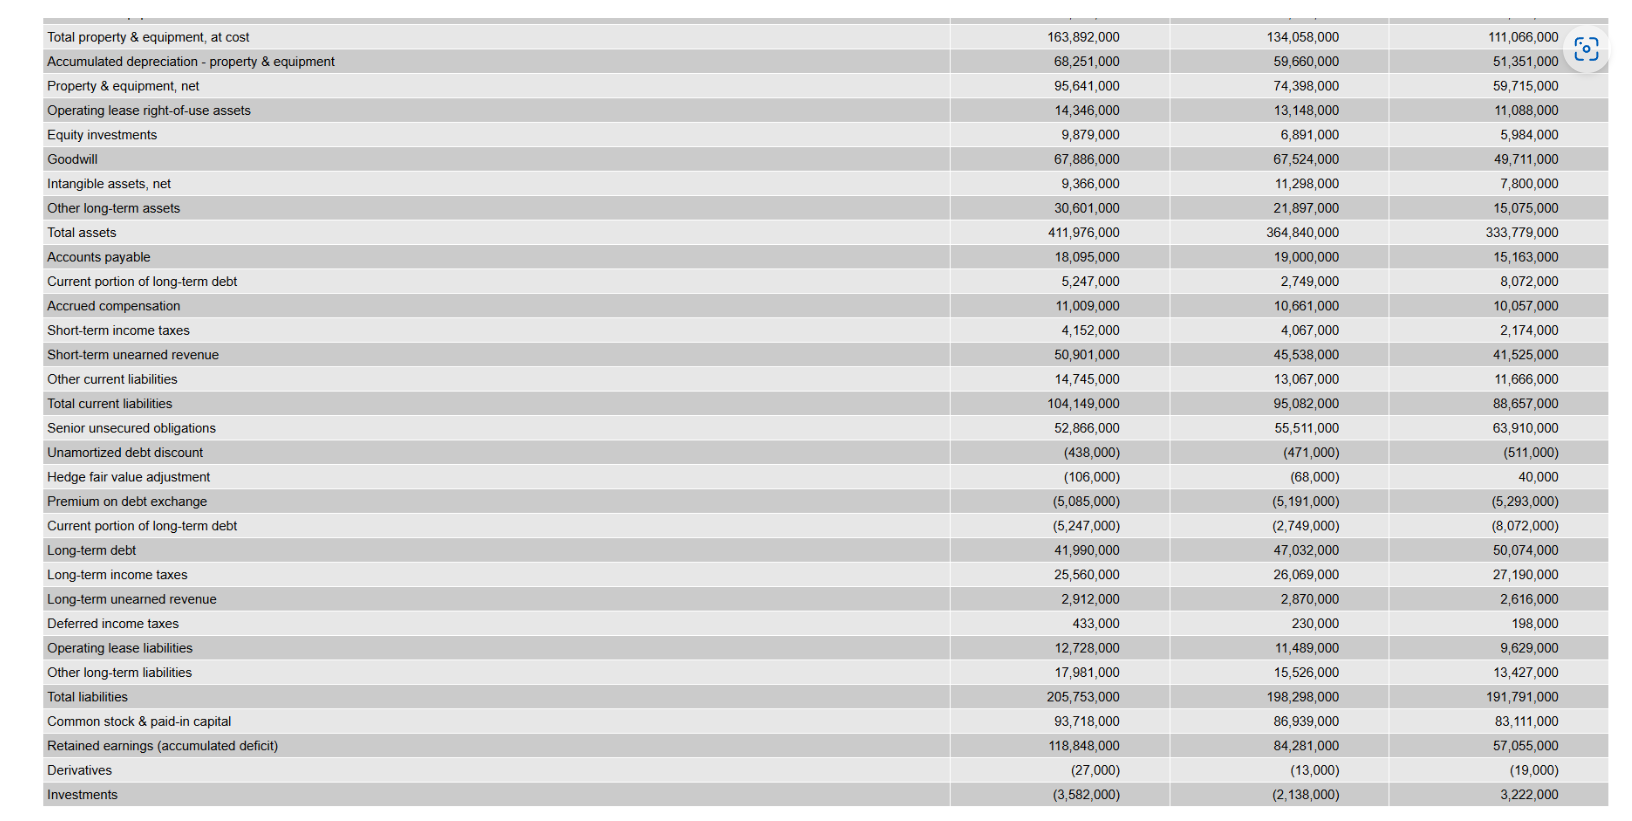
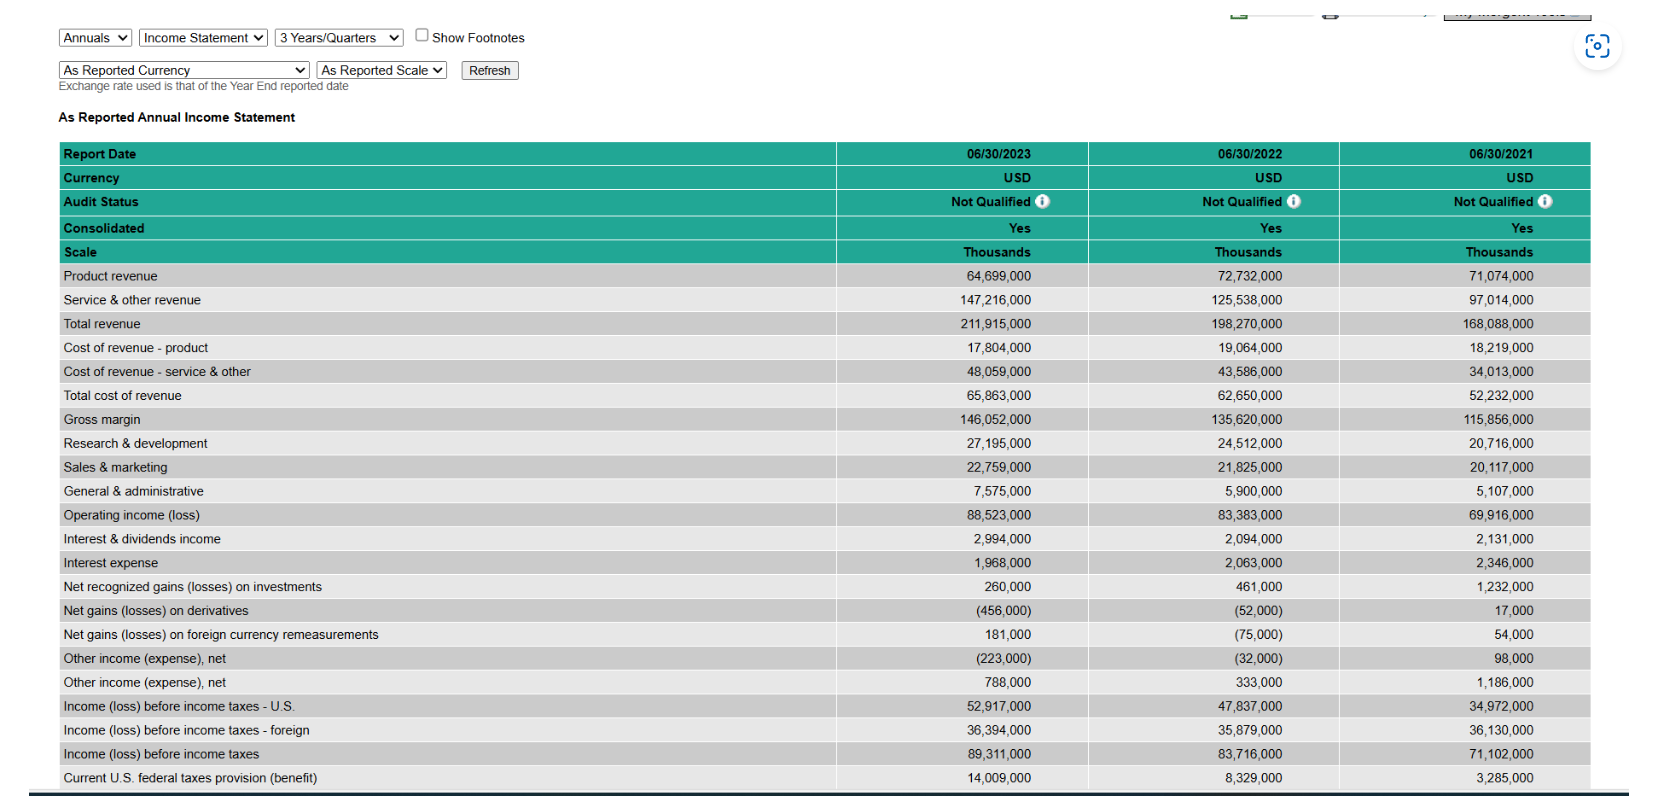
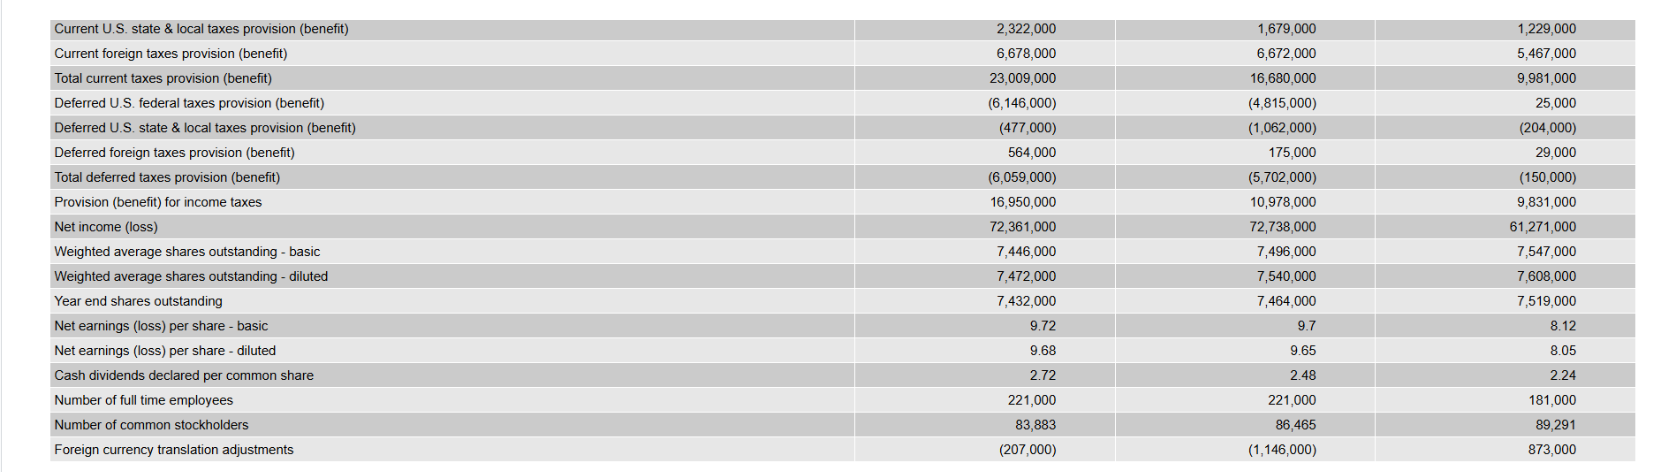
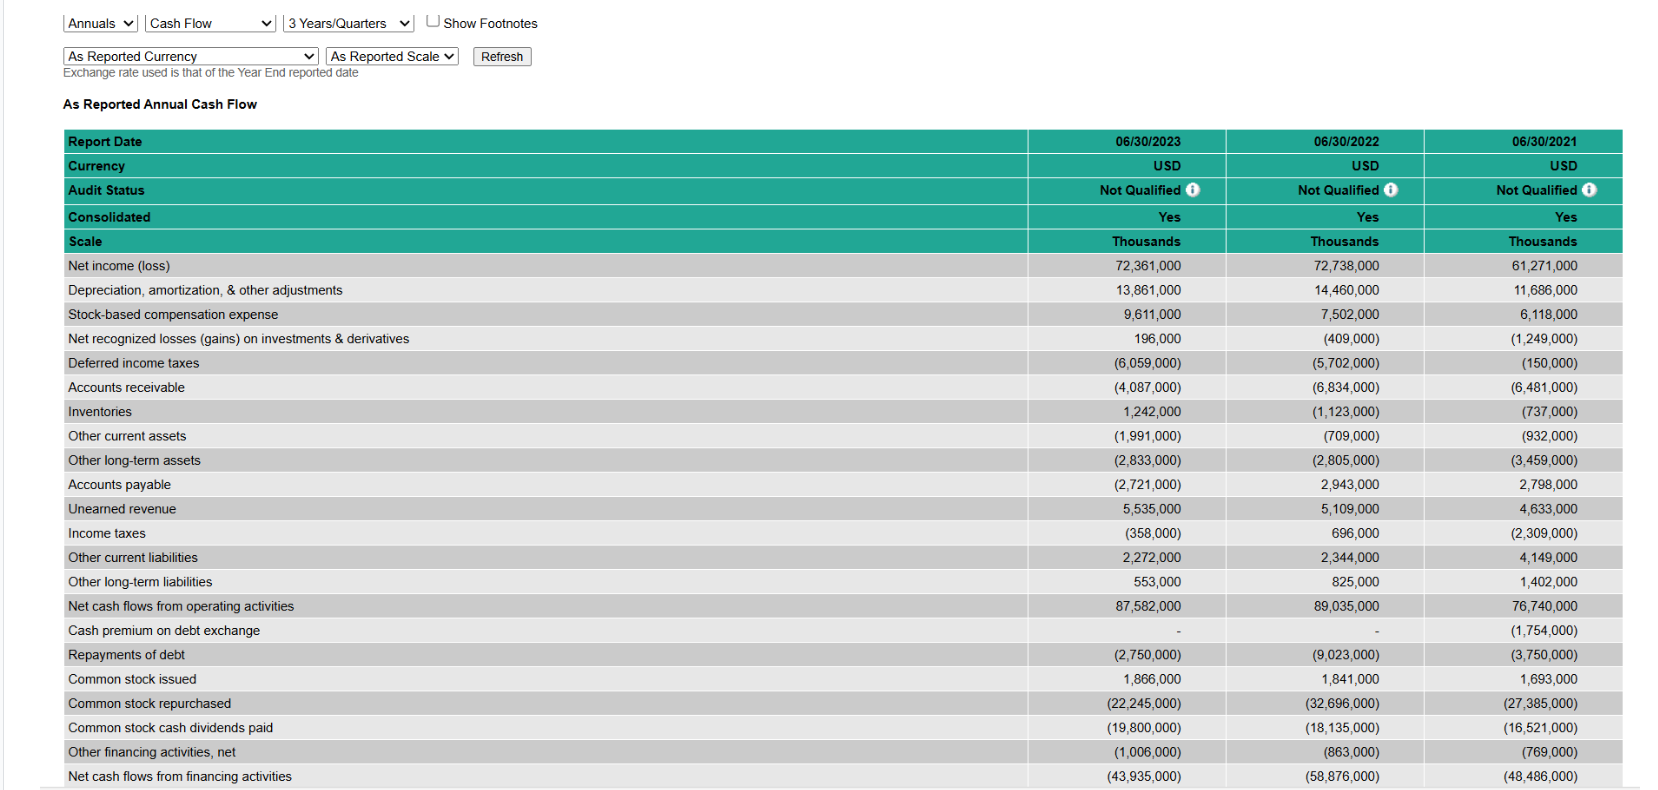
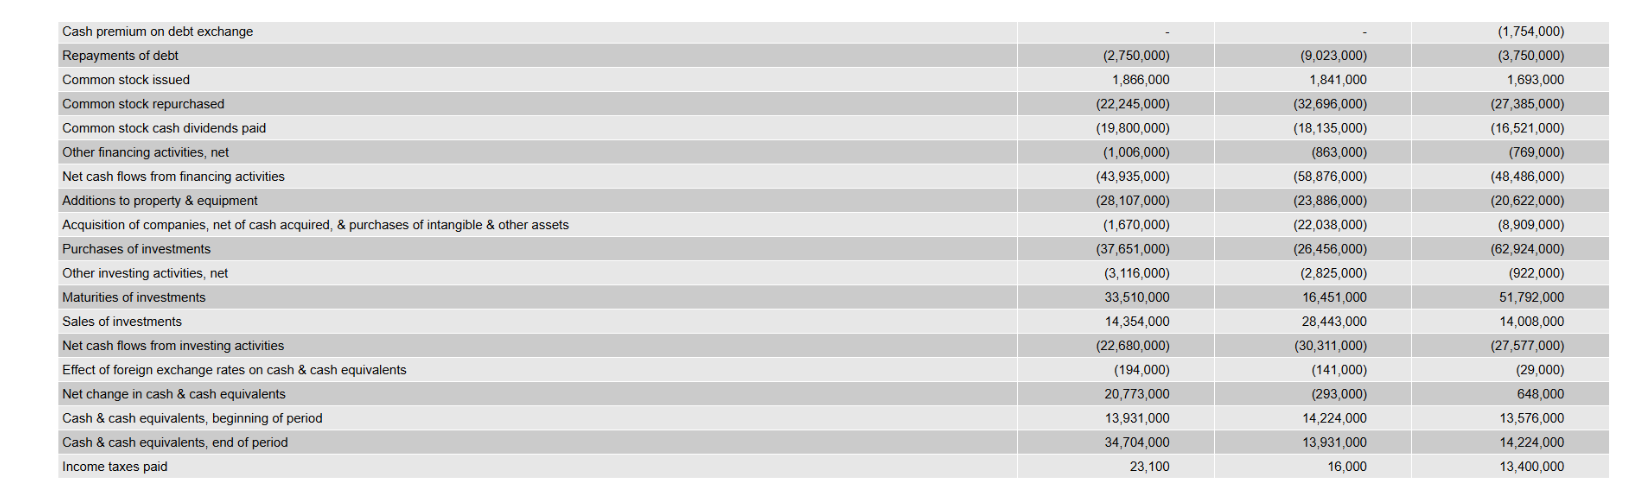
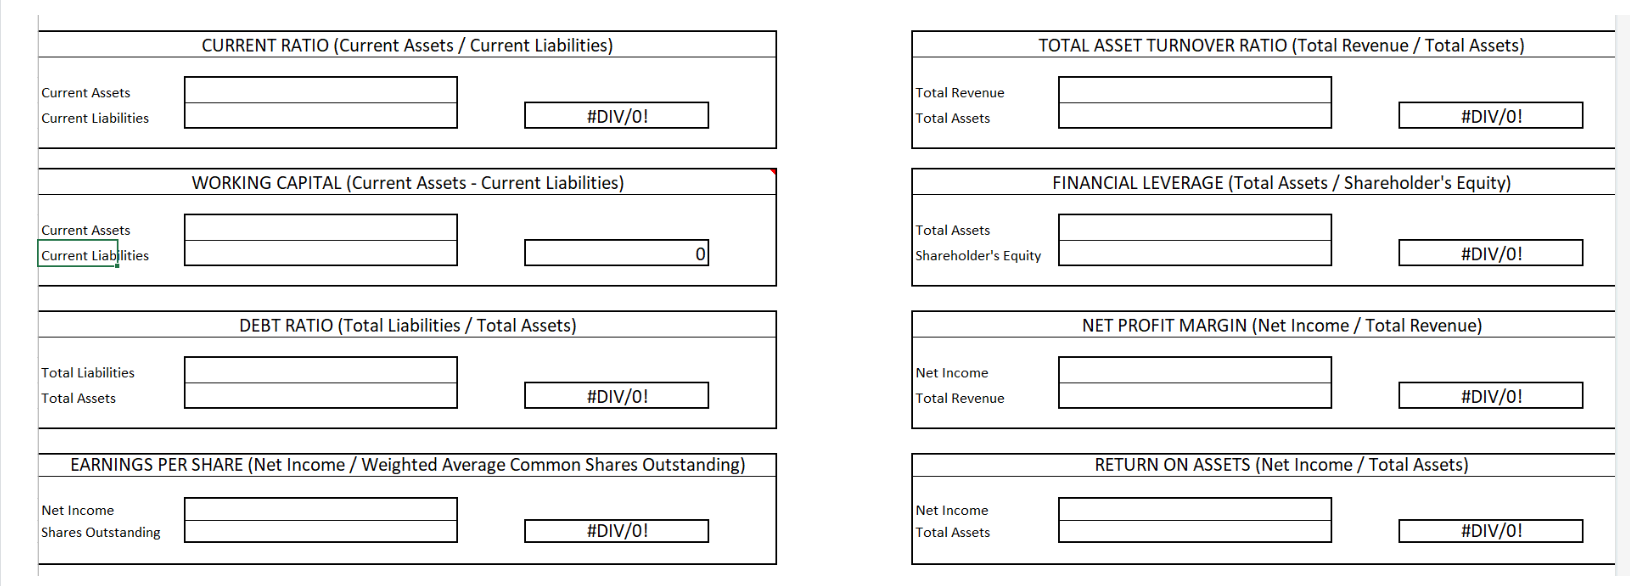
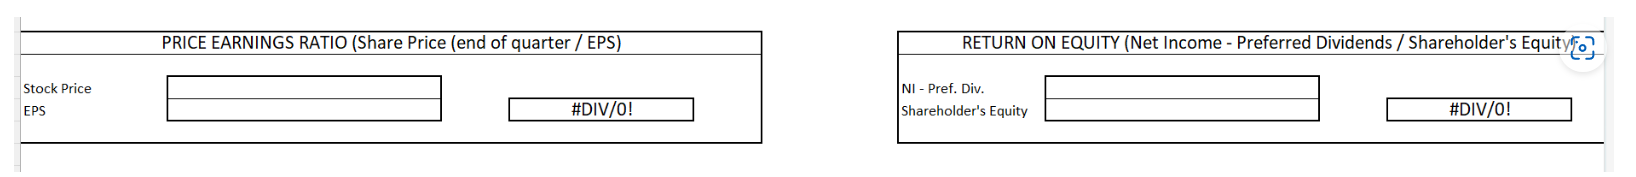
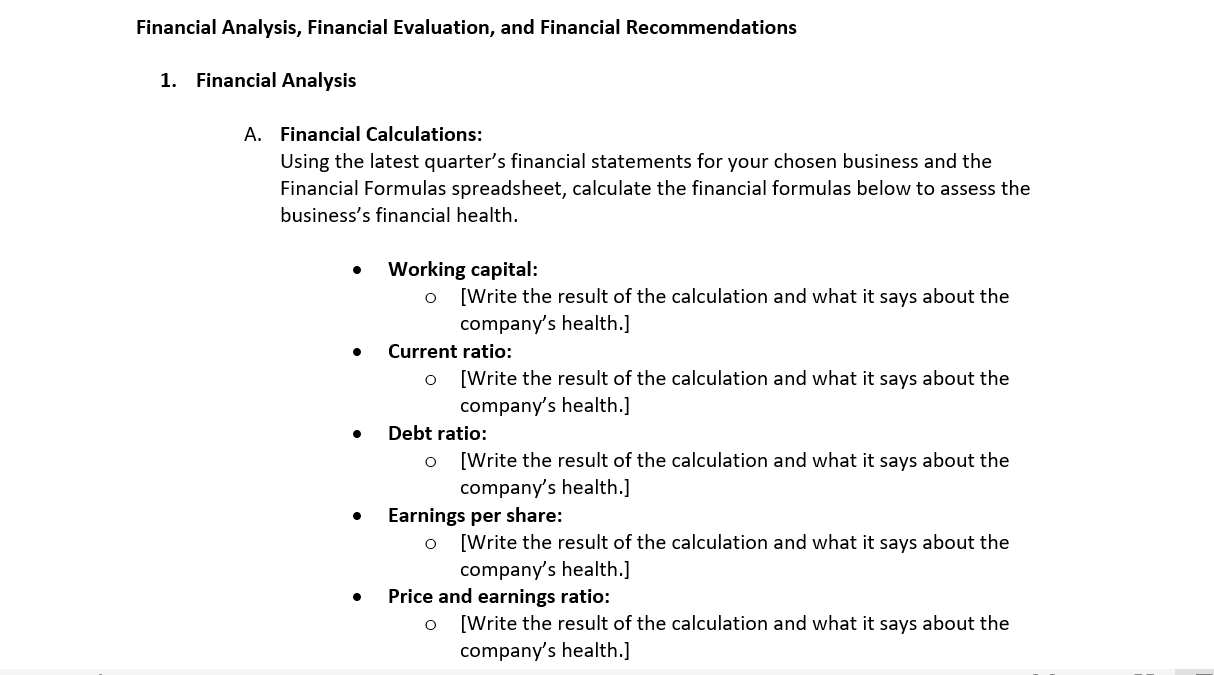
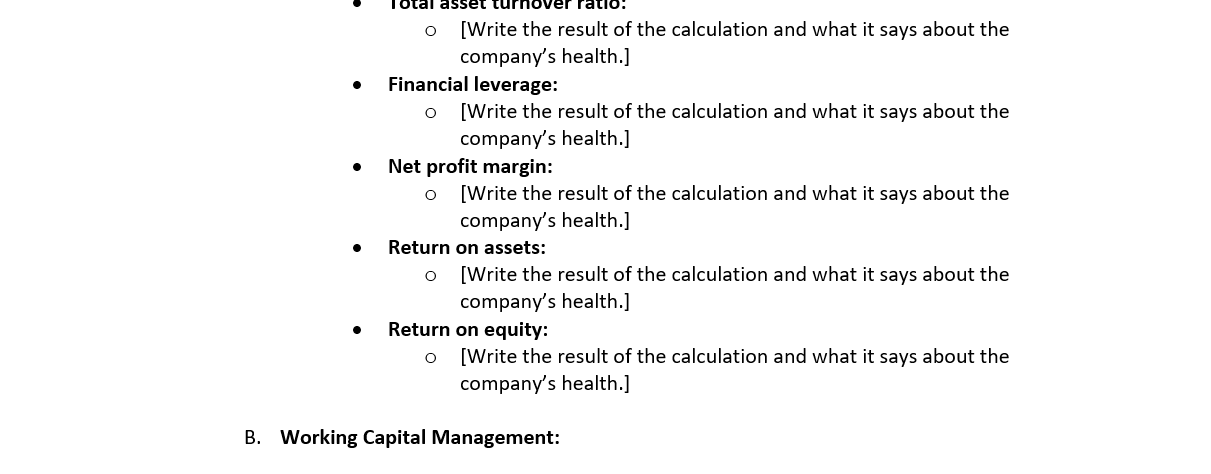
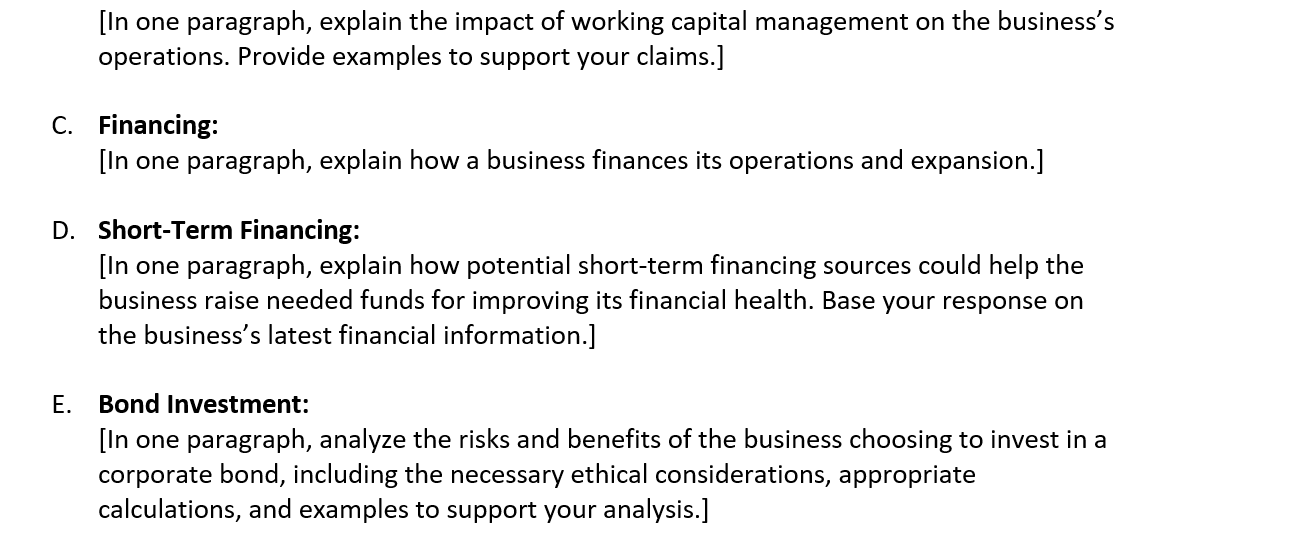
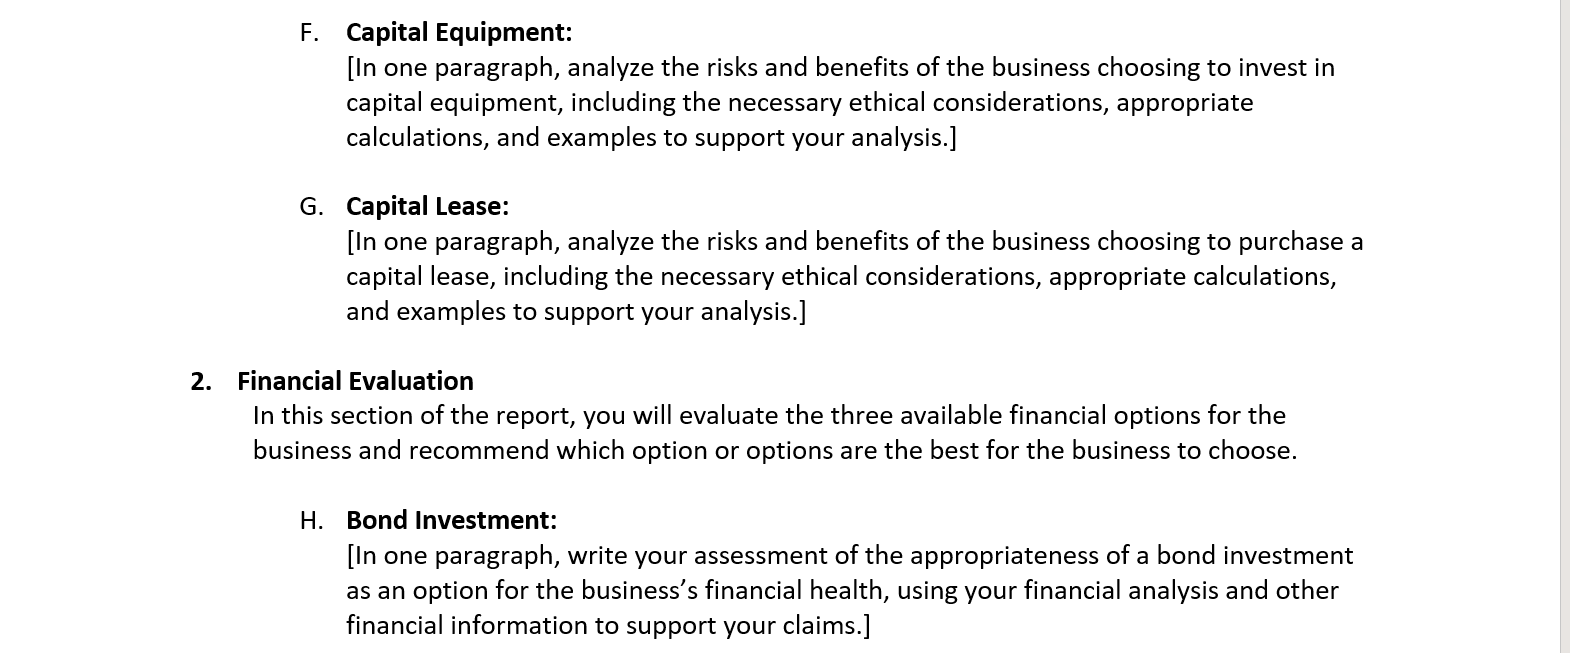
Balance Sheet v [ show Faotnotes |A5 Reported Currency V| |As Reported Scale v ' Refresh Exchange rate used is that of the Year End reported date As Reported Annual Balance Sheet Cash & cash equivalents 34,704,000 13,931,000 14224 000 Shortderm investments 76,558,000 90,826,000 116,110,000 Total cash, cash equivalents, & shortterm investments 111,262,000 104,757,000 130,334,000 Accounts receivable, gross 49,338,000 44,894,000 38,794,000 Allowance for doubtful accounts 650,000 633,000 751,000 Accounts receivable, net 48,688,000 44,261,000 38,043,000 Raw materials 708,000 1,144,000 1,190,000 Work in process 23,000 82,000 79,000 Finished goods 1,768,000 2,516,000 1,367,000 Inventories 2,500,000 3,742,000 2,636,000 Other current assets. 21,807,000 16,924 000 13,393,000 Total current assets 184,257 000 169,684,000 184 406 000 Land 5,683,000 4,734,000 3,660, Buildings & improvements 68,465,000 56,014,000 43 928 000 Leasehold improvments 8,537,000 7,819,000 6,884,000 Computer equipment & software 74,961,000 60,631,000 51,250,000 Furniture & equipment 6,246,000 5,860,000 5,344,000 A wd Total property & equipment, at cost 163,892,000 134,058,000 111,066,000 Accumulated depreciation - property & equipment 68,251,000 59,660,000 51,351,000 Property & equipment, net 95,641,000 74,398,000 59,715,000 Operating lease right-of-use assets 14,346,000 13, 148,000 11,088,000 Equity investments 9,879,000 6,891,000 5,984,000 Goodwill 67,886,000 67,524,000 49,711,000 Intangible assets, net 9, 366,000 11,298,000 7,800,000 Other long-term assets 30,601,000 21,897,000 15,075,000 Total assets 411,976,000 364,840,000 333,779,000 Accounts payable 18,095,000 19,000,000 15, 163,000 Current portion of long-term debt 5,247,000 2,749,000 8,072,000 Accrued compensation 11,009,000 10,661,000 10,057,000 Short-term income taxes 4,152,000 4,067,000 2, 174,000 Short-term unearned revenue 50,901,000 45,538,000 41,525,000 Other current liabilities 14,745,000 13,067,000 11,666,000 Total current liabilities 104, 149,000 95,082,000 88,657,000 Senior unsecured obligations 52,866,000 55,511,000 63,910,000 Unamortized debt discount (438,000) (471,000) (511,000) Hedge fair value adjustment (106,000) (68,000) 40,000 Premium on debt exchange (5,085,000) (5, 191,000) (5,293,000) Current portion of long-term debt (5,247,000) (2,749,000) (8,072,000) Long-term debt 41,990,000 47,032,000 50,074,000 Long-term income taxes 25,560,000 26,069,000 27, 190,000 Long-term unearned revenue 2,912,000 2,870,000 2,616,000 Deferred income taxes 433,000 230,000 198,000 Operating lease liabilities 12,728,000 11,489,000 9,629,000 Other long-term liabilities 17,981,000 15,526,000 13,427,000 Total liabilities 205,753,000 198,298,000 191,791,000 Common stock & paid-in capital 93,718,000 86,939,000 83, 111,000 Retained earnings (accumulated deficit) 118,848,000 84,281,000 57,055,000 Derivatives (27,000) (13,000) (19,000) Investments (3,582,000) (2, 138,000) 3,222,000Translation adjustments & other accumulated other comprehensive income (2,734,000) (2,527,000) (1,381,000) Accumulated other comprehensive income (loss) (6,343,000) (4,678,000) 1,822,000 Total stockholders' equity (deficit) 206,223,000 166,542,000 141,988,000Annuals | [Income Statement v | 3 YearsiQuarters v | [ Show Foatnotes | As Reported Currency As Reported Annual Income Statement ~| [ As Reported Scale v| [ Refresh Excnange rate used is that of the Year End reported date { Service & other revenue Total revenue Cost of revenue - product Cost of revenue - service & other Total cost of revenue Gross margin Research & development Sales & marketing General & administrative Operating income (loss) Interest & dividends income Interest expense INet recognized gains (losses) on investments Net gains (losses) on derivatives Net gains (Iosses) on foreign currency remeasurements Other income (expense), net Other income (expense), net Income (loss) before income taxes - U.S. Income (loss) before income taxes - foreign Income (loss) before income taxes Current U.S. federal taxes provision (benefit) 147,216,000 211,915,000 17,804,000 48,059,000 65,863,000 146,052,000 27,185,000 22,759,000 7,575,000 88,523,000 2,994,000 1,968,000 260,000 (456,000) 181,000 (223,000) 788,000 52,917,000 36,394,000 89,311,000 14,009,000 125,538,000 198,270,000 19,064,000 43,586,000 62,660,000 135,620,000 24,512,000 21,825,000 5,900,000 83,383,000 2,094,000 2,063,000 461,000 (52,000) (75,000) (32,000) 333,000 47,837,000 35,879,000 83,716,000 8,329,000 71,074,000 97,014,000 168,088,000 18,219,000 34,013,000 52,232,000 115,856,000 20,718,000 20,117,000 5,107,000 69,916,000 2,131,000 2,346,000 1,232,000 17,000 54,000 98,000 1,186,000 34,972,000 36,130,000 71,102,000 3,285,000 Current U.S. state & local taxes provision (benefit) 2,322,000 1,679,000 1,229,000 Current foreign taxes provision (benefit) 6,678,000 6,672,000 5,467,000 Total current taxes provision (benefit) 23,009,000 16,680,000 9,981,000 Deferred U.S. federal taxes provision (benefit) (6,146,000) (4,815,000) 25,000 Deferred U.S. state & local taxes provision (benefit) (477,000) (1,062,000) (204,000) Deferred foreign taxes provision (benefit) 564,000 175,000 29,000 Total deferred taxes provision (benefit) (6,059,000) (5,702,000) (150,000) Provision (benefit) for income taxes 16,950,000 10,978,000 9,831,000 Net income (loss) 72,361,000 72,738,000 61,271,000 Weighted average shares outstanding - basic 7,446,000 7,496,000 7,547,000 Weighted average shares outstanding - diluted 7,472,000 7,540,000 7,608,000 Year end shares outstanding 7,432,000 7,464,000 7,519,000 Net earnings (loss) per share - basic 9.72 9.7 8.12 Net earnings (loss) per share - diluted 9.68 9.65 8.05 Cash dividends declared per common share 2.72 2.48 2.24 Number of full time employees 221,000 221,000 181,000 Number of common stockholders 83,883 86,465 89,291 Foreign currency translation adjustments (207,000) (1,146,000) 873,000Annuals v Cash Flow | | 3 Years/Quarters |Show Footnotes As Reported Currency As Reported Scale v Refresh Exchange rate used is that of the Year End reported date As Reported Annual Cash Flow Report Date 06/30/2023 06/30/2022 06/30/2021 Currency USD USD USD Audit Status Not Qualified O Not Qualified O Not Qualified O Consolidated Yes Yes Yes Scale Thousands Thousands Thousands Net income (loss) 72,361,000 72,738,000 61,271,000 Depreciation, amortization, & other adjustments 13,861,000 14,460,000 11,686,000 Stock-based compensation expense 9,611,000 7,502,000 6, 118,000 Net recognized losses (gains) on investments & derivatives 196,000 (409,000) (1,249,000) Deferred income taxes (6,059,000) (5,702,000) (150,000) Accounts receivable (4,087,000) (6,834,000) (6,481,000) Inventories 1,242,000 (1, 123,000) (737,000) Other current assets (1,991,000) (709,000) (932,000) Other long-term assets (2,833,000) (2,805,000) (3,459,000) Accounts payable (2,721,000) 2,943,000 2,798,000 Unearned revenue 5,535,000 5, 109,000 4,633,000 Income taxes (358,000) 696,000 (2,309,000) Other current liabilities 2,272,000 2,344,000 4, 149,000 Other long-term liabilities 553,000 825,000 1,402,000 Net cash flows from operating activities 87,582,000 89,035,000 76,740,000 Cash premium on debt exchange (1,754,000) Repayments of debt (2,750,000) (9,023,000) (3,750,000) Common stock issued 1,866,000 1,841,000 1,693,000 Common stock repurchased (22,245,000) (32,696,000) (27,385,000) Common stock cash dividends paid (19,800,000) (18,135,000) (16,521,000) Other financing activities, net (1,006,000) (863,000) (769,000) Net cash flows from financing activities (43,935,000) (58,876,000) (48,486,000)Cash premium on debt exchange (1,754,000) Repayments of debt (2,750,000) (9,023,000) (3,750,000) Common stock issued 1,866,000 1,841,000 1,693,000 Common stock repurchased (22,245,000) (32,696,000) (27,385,000) Common stock cash dividends paid (19,800,000) (18,135,000) (16,521,000) Other financing activities, net (1,006,000) (863,000) (769,000) Net cash flows from financing activities (43,935,000) (58,876,000) (48,486,000) Additions to property & equipment (28, 107,000) (23,886,000) (20,622,000) Acquisition of companies, net of cash acquired, & purchases of intangible & other assets (1,670,000) (22,038,000) (8,909,000) Purchases of investments (37,651,000) (26,456,000) (62,924,000) Other investing activities, net (3, 116,000) (2,825,000) (922,000) Maturities of investments 33,510,000 16,451,000 51,792,000 Sales of investments 14,354,000 28,443,000 14,008,000 Net cash flows from investing activities (22,680,000) (30,311,000) (27,577,000) Effect of foreign exchange rates on cash & cash equivalents (194,000) (141,000) (29,000) Net change in cash & cash equivalents 20,773,000 (293,000) 648,000 Cash & cash equivalents, beginning of period 13,931,000 14,224,000 13,576,000 Cash & cash equivalents, end of period 34,704,000 13,931,000 14,224,000 Income taxes paid 23, 100 16,000 13,400,000CURRENT RATIO (Current Assets / Current Liabilities) TOTAL ASSET TURNOVER RATIO (Total Revenue / Total Assets) Current Assets Total Revenue Current Liabilities #DIV/O! Total Assets #DIV/O! WORKING CAPITAL (Current Assets - Current Liabilities) FINANCIAL LEVERAGE (Total Assets / Shareholder's Equity) Current Assets Total Assets Current Liabilities Shareholder's Equity #DIV/O! DEBT RATIO (Total Liabilities / Total Assets) NET PROFIT MARGIN (Net Income / Total Revenue) Total Liabilities Net Income Total Assets #DIV/O! Total Revenue #DIV/O! EARNINGS PER SHARE (Net Income / Weighted Average Common Shares Outstanding) RETURN ON ASSETS (Net Income / Total Assets) Net Income Net Income Shares Outstanding #DIV/O! Total Assets #DIV/O!PRICE EARNINGS RATIO (Share Price (end of quarter / EPS) RETURN ON EQUITY (Net Income - Preferred Dividends / Shareholder's EquityTo Stock Price NI - Pref. Div. EPS #DIV/O! Shareholder's Equity #DIV/O!Financial Analysis, Financial Evaluation, and Financial Recommendations 1. Financial Analysis A. Financial Calculations: Using the latest quarter's financial statements for your chosen business and the Financial Formulas spreadsheet, calculate the financial formulas below to assess the business's financial health. Working capital: o [Write the result of the calculation and what it says about the company's health.] Current ratio: o [Write the result of the calculation and what it says about the company's health.] Debt ratio: o [Write the result of the calculation and what it says about the company's health.] Earnings per share: o [Write the result of the calculation and what it says about the company's health.] Price and earnings ratio: o [Write the result of the calculation and what it says about the company's health.] . 10Tal asset turnover rato: o [Write the result of the calculation and what it says about the company's health.] Financial leverage: o [Write the result of the calculation and what it says about the company's health.] Net profit margin: o [Write the result of the calculation and what it says about the company's health.] e Return on assets: o [Write the result of the calculation and what it says about the company's health.] e Return on equity: o [Write the result of the calculation and what it says about the company's health.] B. Working Capital Management: [In one paragraph, explain the impact of working capital management on the business's operations. Provide examples to support your claims.] Financing: [In one paragraph, explain how a business finances its operations and expansion.] Short-Term Financing: [In one paragraph, explain how potential short-term financing sources could help the business raise needed funds for improving its financial health. Base your response on the business's latest financial information.] Bond Investment: [In one paragraph, analyze the risks and benefits of the business choosing to invest in a corporate bond, including the necessary ethical considerations, appropriate calculations, and examples to support your analysis.] F. Capital Equipment: [In one paragraph, analyze the risks and benefits of the business choosing to invest in capital equipment, including the necessary ethical considerations, appropriate calculations, and examples to support your analysis.] G. Capital Lease: [In one paragraph, analyze the risks and benefits of the business choosing to purchase a capital lease, including the necessary ethical considerations, appropriate calculations, and examples to support your analysis.] 2. Financial Evaluation In this section of the report, you will evaluate the three available financial options for the business and recommend which option or options are the best for the business to choose. H. Bond Investment: [In one paragraph, write your assessment of the appropriateness of a bond investment as an option for the business's financial health, using your financial analysis and other financial information to support your claims.] |. Capital Equipment: [In one paragraph, write your assessment on the appropriateness of a capital equipment investment as an option for the business's financial health, using your financial analysis and other financial information to support your claims.] J. Capital Lease: [In one paragraph, write your assessment on the appropriateness of a capital lease purchase as an investment option for the business's financial health, using your financial analysis and other financial information to support your claims.] 3. Future Financial Considerations: [In one paragraph, describe the business's likely future financial performance based on its latest financial well-being and risk level. Use financial information to support your claims.]
Step by Step Solution
There are 3 Steps involved in it
1 Expert Approved Answer
Step: 1 Unlock
Question Has Been Solved by an Expert!
Get step-by-step solutions from verified subject matter experts
Step: 2 Unlock
Step: 3 Unlock
Students Have Also Explored These Related Finance Questions!