

Question: Barratt Plc 2015 MCQ on ratios Based on the separately-supplied extracts from Barratt Development PLC, and the additional information provided below, answer the following multiple
Barratt Plc 2015 MCQ on ratios Based on the separately-supplied extracts from Barratt Development PLC, and the additional information provided below, answer the following multiple choice questions. There is one correct answer for each question and all 15 questions carry equal weight.
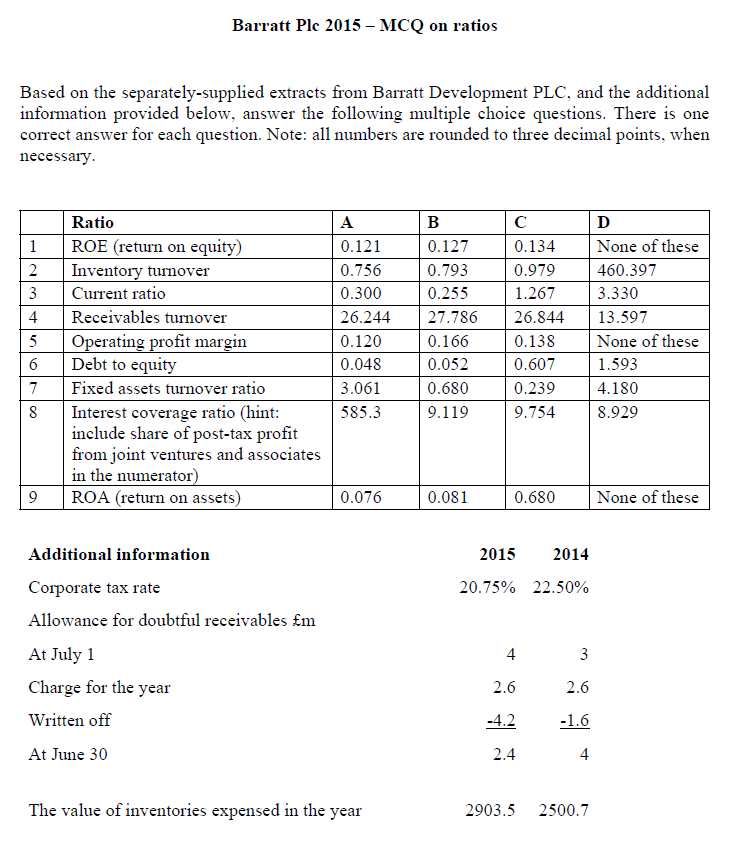
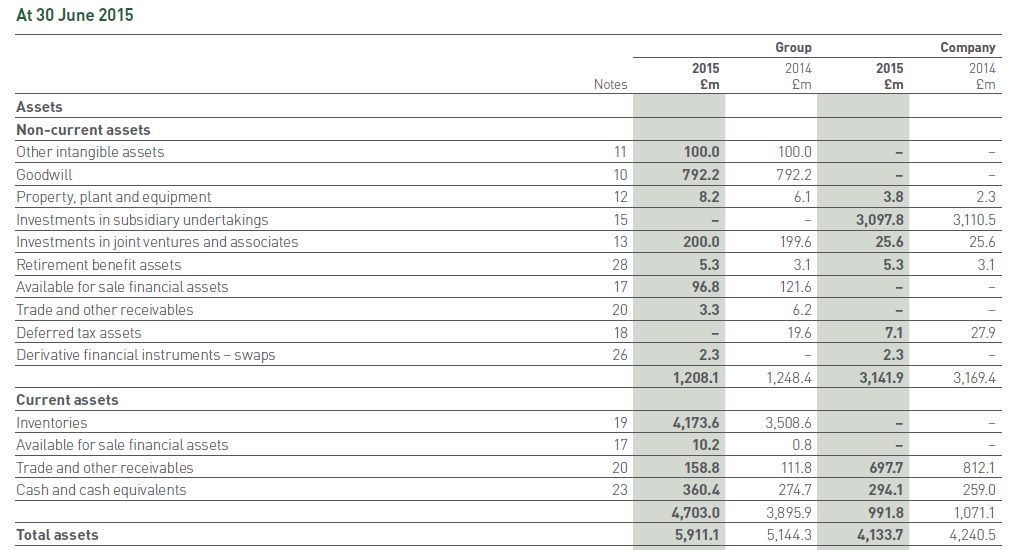
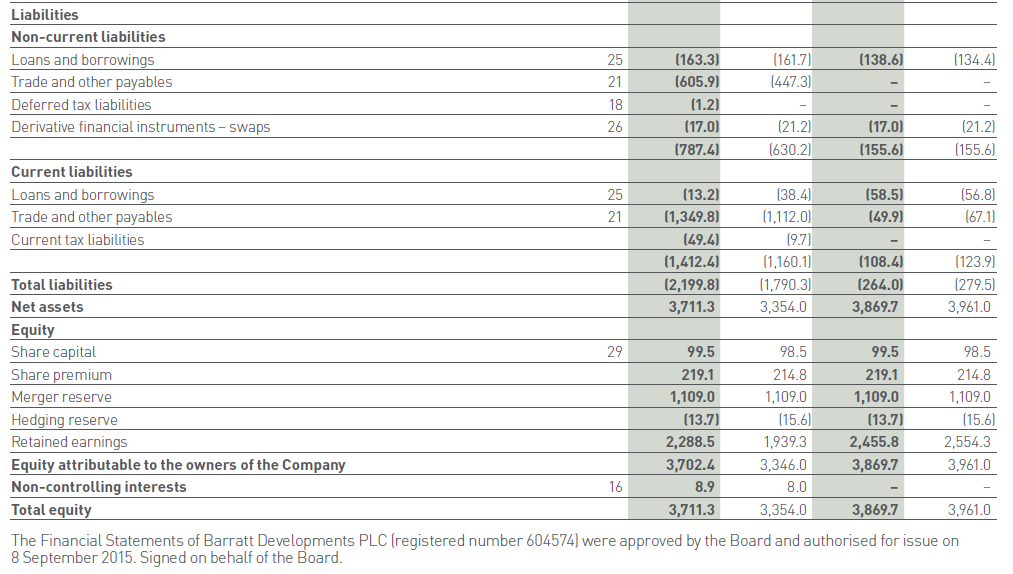
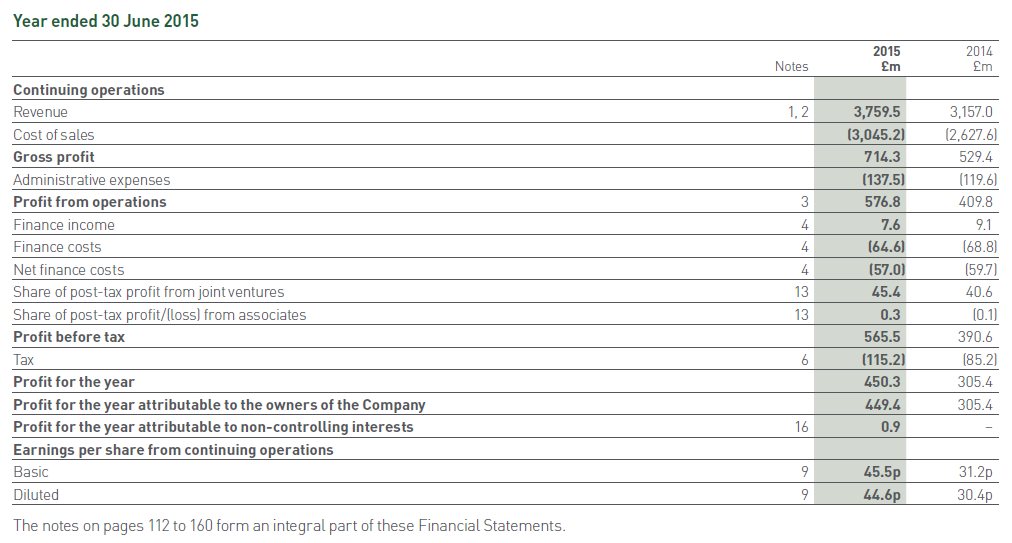
Barratt Plc 2015 - MCQ on ratios Based on the separately-supplied extracts from Barratt Development PLC, and the additional information provided below, answer the following multiple choice questions. There is one correct answer for each question. Note: all numbers are rounded to three decimal points, when necessary A 1 2. 3 4 Ratio ROE (return on equity) Inventory turnover Current ratio Receivables turnover Operating profit margin Debt to equity Fixed assets turnover ratio Interest coverage ratio (hint: include share of post-tax profit from joint ventures and associates in the numerator) ROA (return on assets) 0.121 0.756 0.300 26.244 0.120 0.048 3.061 585.3 B 0.127 0.793 0.255 27.786 0.166 0.052 0.680 9.119 0.134 0.979 1.267 26.844 0.138 0.607 0.239 9.754 D None of these 460.397 3.330 13.597 None of these 1.593 4.180 8.929 5 6 7 8 9 0.076 0.081 0.680 None of these 2015 2014 20.75% 22.50% Additional information Corporate tax rate Allowance for doubtful receivables m At July 1 Charge for the year Written off At June 30 4 3 2.6 2.6 -4.2 -1.6 2.4 4 The value of inventories expensed in the year 2903.5 2500.7 At 30 June 2015 2015 Em Group 2014 m 2015 m Company 2014 m Notes 100.0 792.2 8.2 100.0 792.2 6.1 Assets Non-current assets Other intangible assets Goodwill Property, plant and equipment Investments in subsidiary undertakings Investments in joint ventures and associates Retirement benefit assets Available for sale financial assets Trade and other receivables Deferred tax assets Derivative financial instruments - swaps 11 10 12 15 13 28 17 3.8 3,097.8 25.6 5.3 2.3 3,110.5 25.6 3.1 200.0 5.3 96.8 199.6 3.1 121.6 - 20 3.3 6.2 19.6 27.9 18 26 2.3 1,208.1 7.1 2.3 3,141.9 1,248.4 3,169.4 Current assets Inventories Available for sale financial assets Trade and other receivables Cash and cash equivalents 19 17 812.1 20 23 4,173.6 10.2 158.8 360.4 4,703.0 5,911.1 3,508.6 0.8 111.8 274.7 3,895.9 5,144.3 697.7 294.1 991.8 4,133.7 259.0 1,071.1 4,240.5 Total assets Liabilities Non-current liabilities Loans and borrowings 25 (163.3) (161.7) (138.6) (134.4) Trade and other payables 21 (605.9) (447.3) Deferred tax liabilities 18 (1.2) Derivative financial instruments - Swaps 26 (17.0) (21.2) (17.0) (21.2) 1787.4) 1630.21 (155.6) (155.6) Current liabilities Loans and borrowings 25 (13.2) (38.4) (58.5) (56.8) Trade and other payables 21 (1,349.8) (1,112.0) (49.9) (67.1 Current tax liabilities (49.4) 19.7) (1,412.4) (1,160.1) (108.4) (123.9) Total liabilities (2,199.8) (1.790.3) (264.0) (279.5) Net assets 3,711.3 3,354.0 3,869.7 3,961.0 Equity Share capital 29 99.5 98.5 Share premium 219.1 214.8 219.1 214.8 Merger reserve 1,109.0 1,109.0 1,109.0 1,109.0 Hedging reserve (13.7) (15.6) (13.7) (15.6) Retained earnings 2,288.5 1,939.3 2,455.8 2,554.3 Equity attributable to the owners of the Company 3,702.4 3,346.0 3,869.7 3,961.0 Non-controlling interests 16 8.9 8.0 Total equity 3,711.3 3,354.0 3,869.7 3,961.0 The Financial Statements of Barratt Developments PLC (registered number 604574) were approved by the Board and authorised for issue on 8 September 2015. Signed on behalf of the Board. 98.5 99.5 Year ended 30 June 2015 2015 m 2014 m Notes 1,2 3 4 4 Continuing operations Revenue Cost of sales Gross profit Administrative expenses Profit from operations Finance income Finance costs Net finance costs Share of post-tax profit from joint ventures Share of post-tax profit/(Loss) from associates Profit before tax Tax Profit for the year Profit for the year attributable to the owners of the Company Profit for the year attributable to non-controlling interests Earnings per share from continuing operations Basic Diluted 3,759.5 (3,045.2) 714.3 (137.5) 576.8 7.6 164.6) (57.0) 45.4 0.3 565.5 (115.2) 450.3 449.4 0.9 3.157.0 (2,627.6) 529.4 (119.6) 4098 9.1 (68.8) (59.7) 40.6 (0.1) 390.6 (85.2) 305.4 305.4 13 13 6 16 9 45.5p 44.6p 31.2p 30.4p The notes on pages 112 to 160 form an integral part of these Financial Statements
Step by Step Solution
There are 3 Steps involved in it

Get step-by-step solutions from verified subject matter experts