

Question: base on the below calculation, for the case study please find the error in the forecasted Balance sheet for 2021 to become adjusted the balance
base on the below calculation, for the case study please find the error in the forecasted Balance sheet for 2021 to become adjusted the balance sheet number need to end xxxx,908.
the cost of good sold its equal to sale =3 million
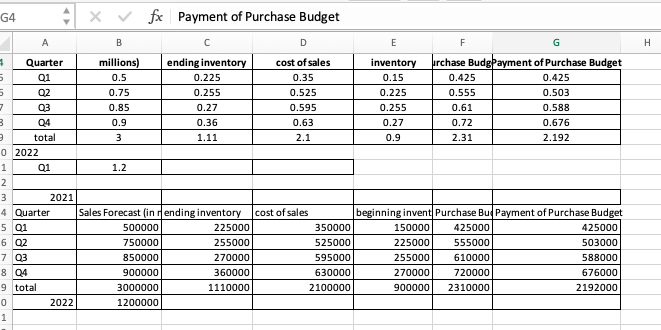
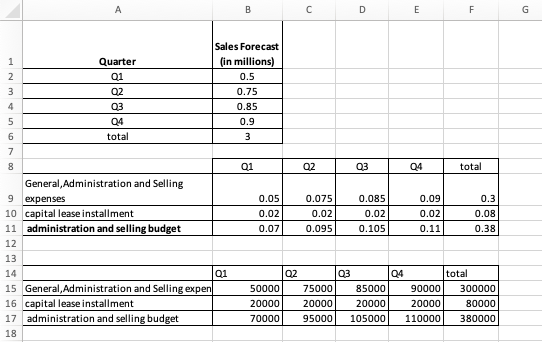
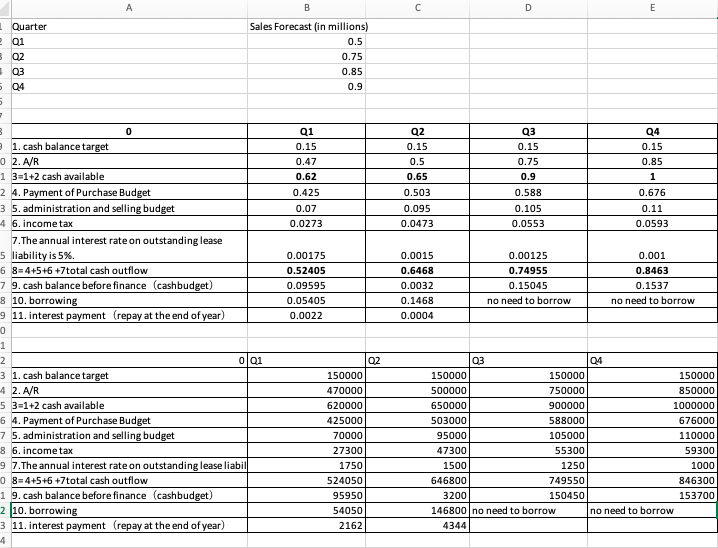
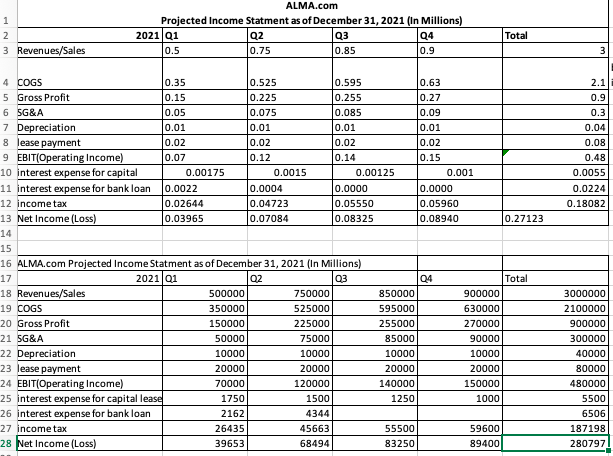
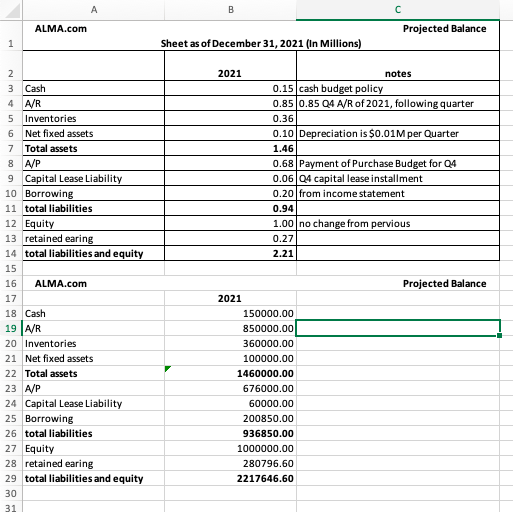
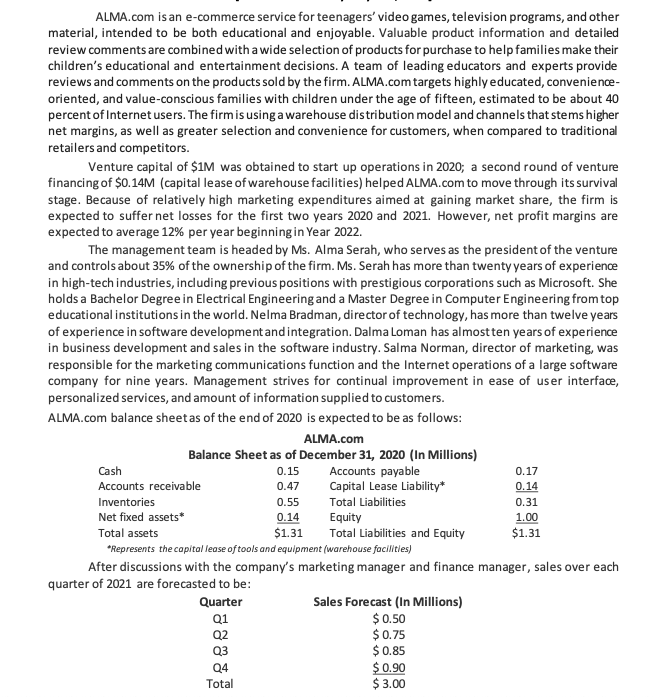
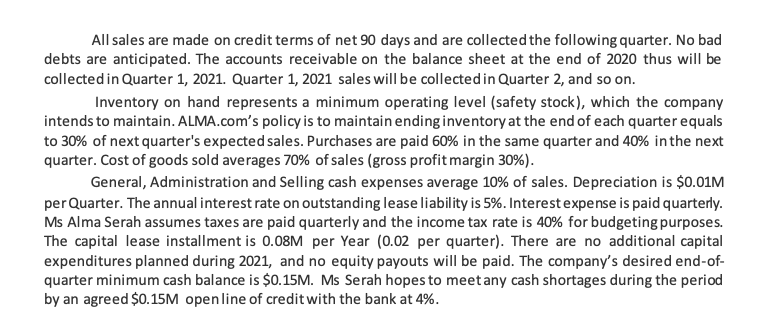
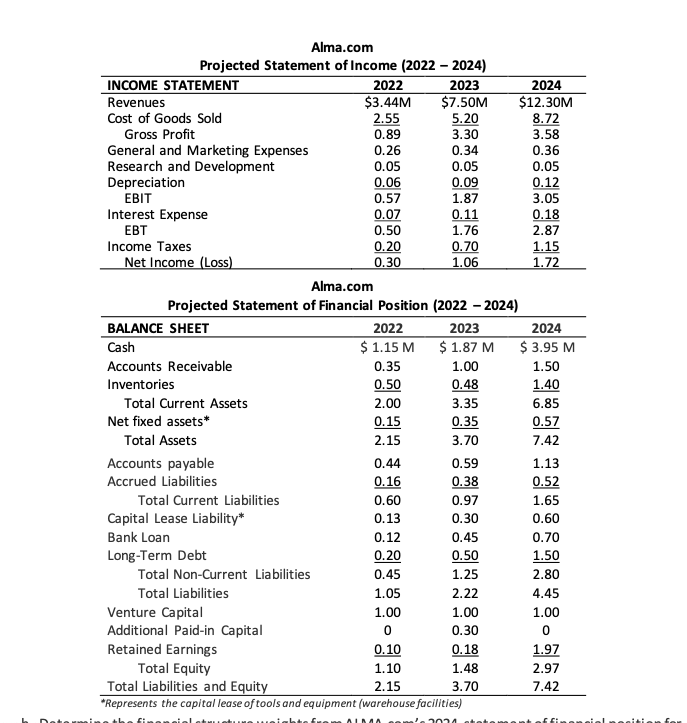
G4 4 x fx Payment of Purchase Budget A B D E F G H TT 5 in cost of sales 0.35 0.525 0.595 0.63 2.1 inventory 0.15 0.225 0.255 0.27 0.9 purchase BudgPayment of Purchase Budget 0.425 0.425 0.555 0.503 0.61 0.588 0.72 0.676 2.31 2.192 3 m Quarter millions) ending inventory 01 0.5 0.225 02 0.75 0.255 03 0.85 0.27 0.9 0.36 total 3 1.11 0 2022 1 Q1 1.2 2 3 2021 4 Quarter Sales Forecast (in ending inventory 5 01 500000 225000 6 02 750000 255000 7 03 850000 270000 8 04 900000 360000 9 total 3000000 1110000 0 2022 1200000 1 cost of sales beginning invent Purchase Bu Payment of Purchase Budget 350000 150000 425000 425000 525000 225000 555000 503000 595000 255000 610000 588000 630000 270000 720000 676000 2100000 900000 2310000 2192000 B D E F G Sales Forecast in millions) 1 Quarter 01 2 0.5 3 02 03 4 0.75 0.85 0.9 3 5 6 7 04 total 8 01 02 03 total 0.09 0.05 0.02 0.07 0.075 0.02 0.095 0.085 0.02 0.105 0.02 0.11 0.3 0.08 0.38 General Administration and Selling 9 expenses 10 capital lease installment 11 administration and selling budget 12 13 14 Q1 15 General Administration and Selling expen 16 capital lease installment 17 administration and selling budget 18 02 03 50000 75000 85000 20000 20000 20000 70000 95000 105000 total 90000 300000 20000 80000 110000 380000 A B D E 1 Quarter Q1 02 03 Sales Forecast (in millions) 0.5 0.75 0.85 5 Q4 0.9 5 3 Q3 0.15 0.75 Q1 0.15 0.47 0.62 0.425 0.07 0.0273 Q2 0.15 0.5 0.65 0.503 0.095 0.0473 0.9 Q4 0.15 0.85 1 0.676 0.11 0.0593 0.588 0.105 0.0553 0.00175 0.52405 0.09595 0.05405 0.0022 0.0015 0.6468 0.0032 0.1468 0.0004 0.00125 0.74955 0.15045 no need to borrow 0.001 0.8463 0.1537 no need to borrow 0 1. cash balance target 02. A/R 1 3=1+2 cash available 2 4. Payment of Purchase Budget 3 5. administration and selling budget 4 6. income tax 7. The annual interest rate on outstanding lease 5 liability is 5% 6 8=4+5+6+7total cash outflow 7 9. cash balance before finance (cashbudget) 8 10. borrowing 9 11. interest payment (repay at the end of year) 0 1 2 O 01 3 1. cash balance target 4 2. A/R 5 3=1+2 cash available 6 4. Payment of Purchase Budget 7 5. administration and selling budget 8 6. income tax 9 7.The annual interest rate on outstanding lease liabil 08=4+5+6+7total cash outflow 1 9. cash balance before finance (cashbudget) 2 10. borrowing 3 11. interest payment (repay at the end of year) 4 02 150000 470000 620000 425000 70000 27300 1750 524050 95950 54050 2162 Q3 Q4 150000 150000 150000 500000 750000 850000 650000 900000 1000000 503000 588000 676000 95000 105000 110000 47300 55300 59300 1500 1250 1000 646800 749550 846300 3200 150450 153700 146800 no need to borrow no need to borrow 4344 1 2 3 Revenues/Sales ALMA.com Projected Income Statment as of December 31, 2021 (In Millions) 2021 91 92 Q3 04 0.5 0.75 0.85 0.9 Total 3 2.1 0.9 0.3 0.04 0.08 0.48 0.0055 0.0224 0.18082 4 COGS 0.35 0.525 0.595 0.63 5 Gross Profit 0.15 0.225 0.255 0.27 6 SG&A 0.05 0.075 0.085 0.09 7 Depreciation 0.01 0.01 0.01 0.01 8 lease payment 0.02 0.02 0.02 0.02 9 EBIT(Operating Income) 0.07 0.12 0.14 0.15 10 interest expense for capital 0.00175 0.0015 0.00125 0.001 11 interest expense for bank loan 0.0022 0.0004 0.0000 0.0000 12 income tax 0.02644 0.04723 0.05550 0.05960 13 Net Income (Loss) 0.03965 0.07084 0.08325 0.08940 0.27123 14 15 16 ALMA.com Projected Income Statment as of December 31, 2021 (In Millions) 2021 01 02 Q3 04 Total 18 Revenues/Sales 500000 750000 850000 900000 19 COGS 350000 525000 595000 630000 20 Gross Profit 150000 225000 255000 270000 21 SG&A 50000 75000 85000 90000 22 Depreciation 10000 10000 10000 10000 23 lease payment 20000 20000 20000 20000 24 EBIT(Operating Income) 70000 120000 140000 150000 25 interest expense for capital lease 1750 1500 1250 1000 26 interest expense for bank loan 2162 4344 27 income tax 26435 45663 55500 59600 28 Net Income (Loss) 39653 68494 83250 89400 17 3000000 2100000 900000 300000 40000 80000 480000 5500 6506 187198 280797 A ALMA.com Projected Balance 1 Sheet as of December 31, 2021 (In Millions) 2021 notes 0.15 cash budget policy 0.85 0.85 Q4 A/R of 2021, following quarter 0.36 0.10 Depreciation is $0.01M per Quarter 1.46 0.68 Payment of Purchase Budget for 04 0.06 04 capital lease installment 0.20 from income statement 0.94 1.00 no change from pervious 0.27 2.21 Projected Balance 2 3 Cash 4 A/R 5 Inventories 6 Net fixed assets 7 Total assets 8 A/P 9 Capital Lease Liability 10 Borrowing 11 total liabilities 12 Equity 13 retained earing 14 total liabilities and equity 15 16 ALMA.com 17 18 Cash 19 A/R 20 Inventories 21 Net fixed assets 22 Total assets 23 A/P 24 Capital Lease Liability 25 Borrowing 26 total liabilities 27 Equity 28 retained earing 29 total liabilities and equity 30 31 2021 150000.00 850000.00 360000.00 100000.00 1460000.00 676000.00 60000.00 200850.00 936850.00 1000000.00 280796.60 2217646.60 ALMA.com is an e-commerce service for teenagers' video games, television programs, and other material, intended to be both educational and enjoyable. Valuable product information and detailed review comments are combined with a wide selection of products for purchase to help families make their children's educational and entertainment decisions. A team of leading educators and experts provide reviews and comments on the products sold by the firm. ALMA.com targets highly educated, convenience- oriented, and value-conscious families with children under the age of fifteen, estimated to be about 40 percent of Internet users. The firm is using a warehouse distribution model and channels that stems higher net margins, as well as greater selection and convenience for customers, when compared to traditional retailers and competitors. Venture capital of $1M was obtained to start up operations in 2020; a second round of venture financing of $0.14M (capital lease of warehouse facilities) helped ALMA.com to move through its survival stage. Because of relatively high marketing expenditures aimed at gaining market share, the firm is expected to suffer net losses for the first two years 2020 and 2021. However, net profit margins are expected to average 12% per year beginning in Year 2022. The management team is headed by Ms. Alma Serah, who serves as the president of the venture and controls about 35% of the ownership of the firm. Ms. Serah has more than twenty years of experience in high-tech industries, including previous positions with prestigious corporations such as Microsoft. She holds a Bachelor Degree in Electrical Engineering and a Master Degree in Computer Engineering from top educational institutions in the world. Nelma Bradman, director of technology, has more than twelve years of experience in software development and integration. Dalma Loman has almost ten years of experience in business development and sales in the software industry. Salma Norman, director of marketing, was responsible for the marketing communications function and the Internet operations of a large software company for nine years. Management strives for continual improvement in ease of user interface, personalized services, and amount of information supplied to customers. ALMA.com balance sheet as of the end of 2020 is expected to be as follows: ALMA.com Balance Sheet as of December 31, 2020 (In Millions) Cash 0.15 Accounts payable 0.17 Accounts receivable 0.47 Capital Lease Liability* 0.14 Inventories 0.55 Total Liabilities Net fixed assets* 0.14 Equity 1.00 Total assets $1.31 Total Liabilities and Equity $1.31 * Represents the capital lease of tools and equipment (warehouse facilities) After discussions with the company's marketing manager and finance manager, sales over each quarter of 2021 are forecasted to be: Quarter Sales Forecast (in Millions) Q1 $ 0.50 Q2 $0.75 Q3 $ 0.85 Q4 $0.90 Total $3.00 0.31 All sales are made on credit terms of net 90 days and are collected the following quarter. No bad debts are anticipated. The accounts receivable on the balance sheet at the end of 2020 thus will be collected in Quarter 1, 2021. Quarter 1, 2021 sales will be collected in Quarter 2, and so on. Inventory on hand represents a minimum operating level (safety stock), which the company intends to maintain. ALMA.com's policy is to maintain ending inventory at the end of each quarter equals to 30% of next quarter's expected sales. Purchases are paid 60% in the same quarter and 40% in the next quarter. Cost of goods sold averages 70% of sales (gross profit margin 30%). General, Administration and Selling cash expenses average 10% of sales. Depreciation is $0.01M per Quarter. The annual interest rate on outstanding lease liability is 5%. Interest expense is paid quarterly. Ms Alma Serah assumes taxes are paid quarterly and the income tax rate is 40% for budgeting purposes. The capital lease installment is 0.08M per Year (0.02 per quarter). There are no additional capital expenditures planned during 2021, and no equity payouts will be paid. The company's desired end-of- quarter minimum cash balance is $0.15M. Ms Serah hopes to meet any cash shortages during the period by an agreed $0.15M openline of credit with the bank at 4%. Alma.com Projected Statement of Income (2022 - 2024) INCOME STATEMENT 2022 2023 2024 Revenues $3.44M $7.50M $12.30M Cost of Goods Sold 2.55 5.20 8.72 Gross Profit 0.89 3.30 3.58 General and Marketing Expenses 0.26 0.34 0.36 Research and Development 0.05 0.05 0.05 Depreciation 0.06 0.09 0.12 EBIT 0.57 1.87 3.05 Interest Expense 0.07 0.11 0.18 EBT 0.50 1.76 2.87 Income Taxes 0.20 0.70 1.15 Net Income (Loss) 0.30 1.06 1.72 Alma.com Projected Statement of Financial Position (2022 - 2024) BALANCE SHEET 2022 2023 2024 Cash $ 1.15 M $ 1.87 M $ 3.95 M Accounts Receivable 0.35 1.00 1.50 Inventories 0.50 0.48 1.40 Total Current Assets 2.00 3.35 6.85 Net fixed assets* 0.15 0.35 0.57 Total Assets 2.15 3.70 7.42 Accounts payable 0.44 0.59 1.13 Accrued Liabilities 0.16 0.38 0.52 Total Current Liabilities 0.60 0.97 1.65 Capital Lease Liability* 0.13 0.30 0.60 Bank Loan 0.12 0.45 0.70 Long-Term Debt 0.20 0.50 Total Non-Current Liabilities 0.45 1.25 2.80 Total Liabilities 1.05 2.22 4.45 Venture Capital 1.00 1.00 1.00 Additional Paid-in Capital 0 0.30 0 Retained Earnings 0.10 0.18 1.97 Total Equity 1.10 1.48 2.97 Total Liabilities and Equity 2.15 3.70 7.42 *Represents the capital lease of tools and equipment (warehouse facilities) 1.50 denna G4 4 x fx Payment of Purchase Budget A B D E F G H TT 5 in cost of sales 0.35 0.525 0.595 0.63 2.1 inventory 0.15 0.225 0.255 0.27 0.9 purchase BudgPayment of Purchase Budget 0.425 0.425 0.555 0.503 0.61 0.588 0.72 0.676 2.31 2.192 3 m Quarter millions) ending inventory 01 0.5 0.225 02 0.75 0.255 03 0.85 0.27 0.9 0.36 total 3 1.11 0 2022 1 Q1 1.2 2 3 2021 4 Quarter Sales Forecast (in ending inventory 5 01 500000 225000 6 02 750000 255000 7 03 850000 270000 8 04 900000 360000 9 total 3000000 1110000 0 2022 1200000 1 cost of sales beginning invent Purchase Bu Payment of Purchase Budget 350000 150000 425000 425000 525000 225000 555000 503000 595000 255000 610000 588000 630000 270000 720000 676000 2100000 900000 2310000 2192000 B D E F G Sales Forecast in millions) 1 Quarter 01 2 0.5 3 02 03 4 0.75 0.85 0.9 3 5 6 7 04 total 8 01 02 03 total 0.09 0.05 0.02 0.07 0.075 0.02 0.095 0.085 0.02 0.105 0.02 0.11 0.3 0.08 0.38 General Administration and Selling 9 expenses 10 capital lease installment 11 administration and selling budget 12 13 14 Q1 15 General Administration and Selling expen 16 capital lease installment 17 administration and selling budget 18 02 03 50000 75000 85000 20000 20000 20000 70000 95000 105000 total 90000 300000 20000 80000 110000 380000 A B D E 1 Quarter Q1 02 03 Sales Forecast (in millions) 0.5 0.75 0.85 5 Q4 0.9 5 3 Q3 0.15 0.75 Q1 0.15 0.47 0.62 0.425 0.07 0.0273 Q2 0.15 0.5 0.65 0.503 0.095 0.0473 0.9 Q4 0.15 0.85 1 0.676 0.11 0.0593 0.588 0.105 0.0553 0.00175 0.52405 0.09595 0.05405 0.0022 0.0015 0.6468 0.0032 0.1468 0.0004 0.00125 0.74955 0.15045 no need to borrow 0.001 0.8463 0.1537 no need to borrow 0 1. cash balance target 02. A/R 1 3=1+2 cash available 2 4. Payment of Purchase Budget 3 5. administration and selling budget 4 6. income tax 7. The annual interest rate on outstanding lease 5 liability is 5% 6 8=4+5+6+7total cash outflow 7 9. cash balance before finance (cashbudget) 8 10. borrowing 9 11. interest payment (repay at the end of year) 0 1 2 O 01 3 1. cash balance target 4 2. A/R 5 3=1+2 cash available 6 4. Payment of Purchase Budget 7 5. administration and selling budget 8 6. income tax 9 7.The annual interest rate on outstanding lease liabil 08=4+5+6+7total cash outflow 1 9. cash balance before finance (cashbudget) 2 10. borrowing 3 11. interest payment (repay at the end of year) 4 02 150000 470000 620000 425000 70000 27300 1750 524050 95950 54050 2162 Q3 Q4 150000 150000 150000 500000 750000 850000 650000 900000 1000000 503000 588000 676000 95000 105000 110000 47300 55300 59300 1500 1250 1000 646800 749550 846300 3200 150450 153700 146800 no need to borrow no need to borrow 4344 1 2 3 Revenues/Sales ALMA.com Projected Income Statment as of December 31, 2021 (In Millions) 2021 91 92 Q3 04 0.5 0.75 0.85 0.9 Total 3 2.1 0.9 0.3 0.04 0.08 0.48 0.0055 0.0224 0.18082 4 COGS 0.35 0.525 0.595 0.63 5 Gross Profit 0.15 0.225 0.255 0.27 6 SG&A 0.05 0.075 0.085 0.09 7 Depreciation 0.01 0.01 0.01 0.01 8 lease payment 0.02 0.02 0.02 0.02 9 EBIT(Operating Income) 0.07 0.12 0.14 0.15 10 interest expense for capital 0.00175 0.0015 0.00125 0.001 11 interest expense for bank loan 0.0022 0.0004 0.0000 0.0000 12 income tax 0.02644 0.04723 0.05550 0.05960 13 Net Income (Loss) 0.03965 0.07084 0.08325 0.08940 0.27123 14 15 16 ALMA.com Projected Income Statment as of December 31, 2021 (In Millions) 2021 01 02 Q3 04 Total 18 Revenues/Sales 500000 750000 850000 900000 19 COGS 350000 525000 595000 630000 20 Gross Profit 150000 225000 255000 270000 21 SG&A 50000 75000 85000 90000 22 Depreciation 10000 10000 10000 10000 23 lease payment 20000 20000 20000 20000 24 EBIT(Operating Income) 70000 120000 140000 150000 25 interest expense for capital lease 1750 1500 1250 1000 26 interest expense for bank loan 2162 4344 27 income tax 26435 45663 55500 59600 28 Net Income (Loss) 39653 68494 83250 89400 17 3000000 2100000 900000 300000 40000 80000 480000 5500 6506 187198 280797 A ALMA.com Projected Balance 1 Sheet as of December 31, 2021 (In Millions) 2021 notes 0.15 cash budget policy 0.85 0.85 Q4 A/R of 2021, following quarter 0.36 0.10 Depreciation is $0.01M per Quarter 1.46 0.68 Payment of Purchase Budget for 04 0.06 04 capital lease installment 0.20 from income statement 0.94 1.00 no change from pervious 0.27 2.21 Projected Balance 2 3 Cash 4 A/R 5 Inventories 6 Net fixed assets 7 Total assets 8 A/P 9 Capital Lease Liability 10 Borrowing 11 total liabilities 12 Equity 13 retained earing 14 total liabilities and equity 15 16 ALMA.com 17 18 Cash 19 A/R 20 Inventories 21 Net fixed assets 22 Total assets 23 A/P 24 Capital Lease Liability 25 Borrowing 26 total liabilities 27 Equity 28 retained earing 29 total liabilities and equity 30 31 2021 150000.00 850000.00 360000.00 100000.00 1460000.00 676000.00 60000.00 200850.00 936850.00 1000000.00 280796.60 2217646.60 ALMA.com is an e-commerce service for teenagers' video games, television programs, and other material, intended to be both educational and enjoyable. Valuable product information and detailed review comments are combined with a wide selection of products for purchase to help families make their children's educational and entertainment decisions. A team of leading educators and experts provide reviews and comments on the products sold by the firm. ALMA.com targets highly educated, convenience- oriented, and value-conscious families with children under the age of fifteen, estimated to be about 40 percent of Internet users. The firm is using a warehouse distribution model and channels that stems higher net margins, as well as greater selection and convenience for customers, when compared to traditional retailers and competitors. Venture capital of $1M was obtained to start up operations in 2020; a second round of venture financing of $0.14M (capital lease of warehouse facilities) helped ALMA.com to move through its survival stage. Because of relatively high marketing expenditures aimed at gaining market share, the firm is expected to suffer net losses for the first two years 2020 and 2021. However, net profit margins are expected to average 12% per year beginning in Year 2022. The management team is headed by Ms. Alma Serah, who serves as the president of the venture and controls about 35% of the ownership of the firm. Ms. Serah has more than twenty years of experience in high-tech industries, including previous positions with prestigious corporations such as Microsoft. She holds a Bachelor Degree in Electrical Engineering and a Master Degree in Computer Engineering from top educational institutions in the world. Nelma Bradman, director of technology, has more than twelve years of experience in software development and integration. Dalma Loman has almost ten years of experience in business development and sales in the software industry. Salma Norman, director of marketing, was responsible for the marketing communications function and the Internet operations of a large software company for nine years. Management strives for continual improvement in ease of user interface, personalized services, and amount of information supplied to customers. ALMA.com balance sheet as of the end of 2020 is expected to be as follows: ALMA.com Balance Sheet as of December 31, 2020 (In Millions) Cash 0.15 Accounts payable 0.17 Accounts receivable 0.47 Capital Lease Liability* 0.14 Inventories 0.55 Total Liabilities Net fixed assets* 0.14 Equity 1.00 Total assets $1.31 Total Liabilities and Equity $1.31 * Represents the capital lease of tools and equipment (warehouse facilities) After discussions with the company's marketing manager and finance manager, sales over each quarter of 2021 are forecasted to be: Quarter Sales Forecast (in Millions) Q1 $ 0.50 Q2 $0.75 Q3 $ 0.85 Q4 $0.90 Total $3.00 0.31 All sales are made on credit terms of net 90 days and are collected the following quarter. No bad debts are anticipated. The accounts receivable on the balance sheet at the end of 2020 thus will be collected in Quarter 1, 2021. Quarter 1, 2021 sales will be collected in Quarter 2, and so on. Inventory on hand represents a minimum operating level (safety stock), which the company intends to maintain. ALMA.com's policy is to maintain ending inventory at the end of each quarter equals to 30% of next quarter's expected sales. Purchases are paid 60% in the same quarter and 40% in the next quarter. Cost of goods sold averages 70% of sales (gross profit margin 30%). General, Administration and Selling cash expenses average 10% of sales. Depreciation is $0.01M per Quarter. The annual interest rate on outstanding lease liability is 5%. Interest expense is paid quarterly. Ms Alma Serah assumes taxes are paid quarterly and the income tax rate is 40% for budgeting purposes. The capital lease installment is 0.08M per Year (0.02 per quarter). There are no additional capital expenditures planned during 2021, and no equity payouts will be paid. The company's desired end-of- quarter minimum cash balance is $0.15M. Ms Serah hopes to meet any cash shortages during the period by an agreed $0.15M openline of credit with the bank at 4%. Alma.com Projected Statement of Income (2022 - 2024) INCOME STATEMENT 2022 2023 2024 Revenues $3.44M $7.50M $12.30M Cost of Goods Sold 2.55 5.20 8.72 Gross Profit 0.89 3.30 3.58 General and Marketing Expenses 0.26 0.34 0.36 Research and Development 0.05 0.05 0.05 Depreciation 0.06 0.09 0.12 EBIT 0.57 1.87 3.05 Interest Expense 0.07 0.11 0.18 EBT 0.50 1.76 2.87 Income Taxes 0.20 0.70 1.15 Net Income (Loss) 0.30 1.06 1.72 Alma.com Projected Statement of Financial Position (2022 - 2024) BALANCE SHEET 2022 2023 2024 Cash $ 1.15 M $ 1.87 M $ 3.95 M Accounts Receivable 0.35 1.00 1.50 Inventories 0.50 0.48 1.40 Total Current Assets 2.00 3.35 6.85 Net fixed assets* 0.15 0.35 0.57 Total Assets 2.15 3.70 7.42 Accounts payable 0.44 0.59 1.13 Accrued Liabilities 0.16 0.38 0.52 Total Current Liabilities 0.60 0.97 1.65 Capital Lease Liability* 0.13 0.30 0.60 Bank Loan 0.12 0.45 0.70 Long-Term Debt 0.20 0.50 Total Non-Current Liabilities 0.45 1.25 2.80 Total Liabilities 1.05 2.22 4.45 Venture Capital 1.00 1.00 1.00 Additional Paid-in Capital 0 0.30 0 Retained Earnings 0.10 0.18 1.97 Total Equity 1.10 1.48 2.97 Total Liabilities and Equity 2.15 3.70 7.42 *Represents the capital lease of tools and equipment (warehouse facilities) 1.50 denna
Step by Step Solution
There are 3 Steps involved in it

Get step-by-step solutions from verified subject matter experts