

Question: Based off the figures provided in the table. Please provide a detailed interpretation of what the table shows. Table shows ratios of Gap Inc. compared
Based off the figures provided in the table. Please provide a detailed interpretation of what the table shows. Table shows ratios of Gap Inc. compared to Express, Ross and Nordstrom financial statement ratios
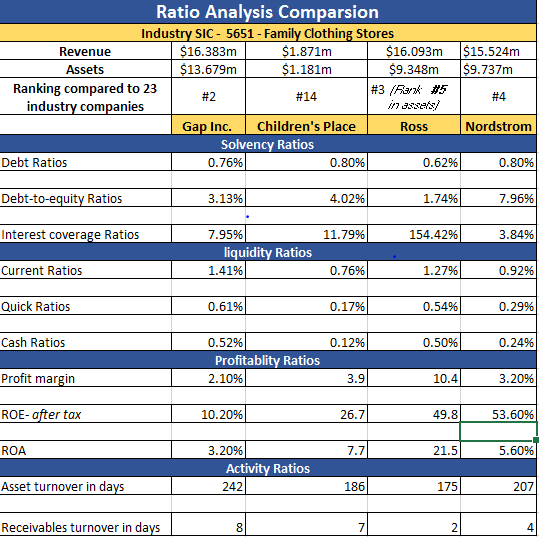
$15.524m $9.737m Ratio Analysis Comparsion Industry SIC - 5651 - Family Clothing Stores Revenue $16.383m $1.871m $16.093m Assets $13.679m $1.181m $9.348m Ranking compared to 23 #2 #14 #3 /m #5 industry companies Gap Inc. Children's Place Ross Solvency Ratios Debt Ratios 0.76% 0.80% 0.62% #4 Nordstrom 0.80% Debt-to-equity Ratios 3.13% 4.02% 1.74% 7.96% Interest coverage Ratios 11.79% 154.42% 3.84% 7.95% liquidity Ratios 1.41% Current Ratios 0.76% 1.27% 0.92% Quick Ratios 0.61% 0.17% 0.54% 0.29% Cash Ratios 0.12% 0.509% 0.24% 0.52% Profitablity Ratios 2.10% Profit margin 3.9 10.4 3.20% ROE- after tax 10.20% 26.7 49.8 53.60% ROA 7.7 21.5 5.60% 3.20% Activity Ratios 242 Asset turnover in days 186 175 207 Receivables turnover in days 8 7 2
Step by Step Solution
There are 3 Steps involved in it

Get step-by-step solutions from verified subject matter experts