

Question: BASED ON CASE STUDY ONTELA PICDECK B 1. What are the benefits and drawbacks of Doing Persona Development before quantitative Cluster analysis versus cluster analysis
BASED ON CASE STUDY ONTELA PICDECK B
1. What are the benefits and drawbacks of Doing Persona Development before quantitative Cluster analysis versus cluster analysis before persona development
2. Why do we still need profiling information (demographics and media use)?
3. Demographics and Media Use Information. What Variables most strongly distinguish the cluster from one another? Which are weakest?
4. What Variables most strongly distinguish the cluster from one another?
5. To what extent does demographic and media use data line up with our earlier analysis> Evaluate each cluster! Example : Could be Cluster 1 Sarah? Regina or Steve etc
6. What Clusters would you choose based on the demographic data?
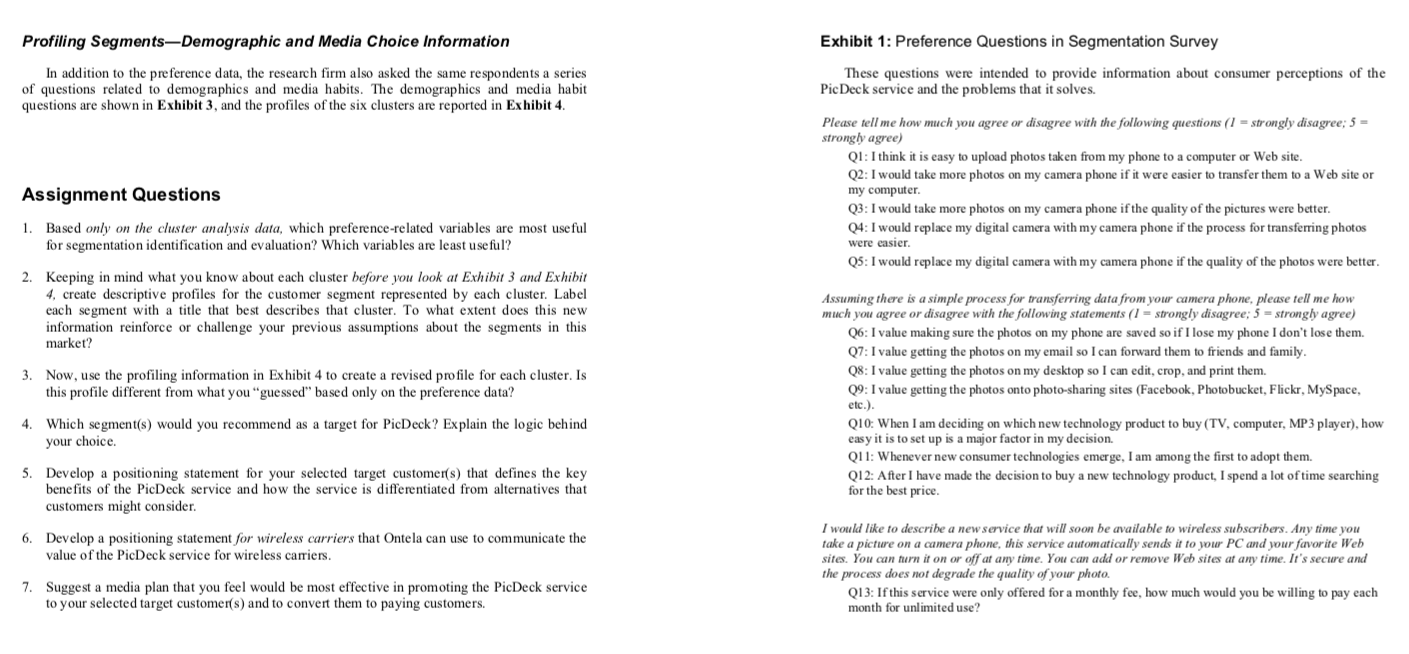
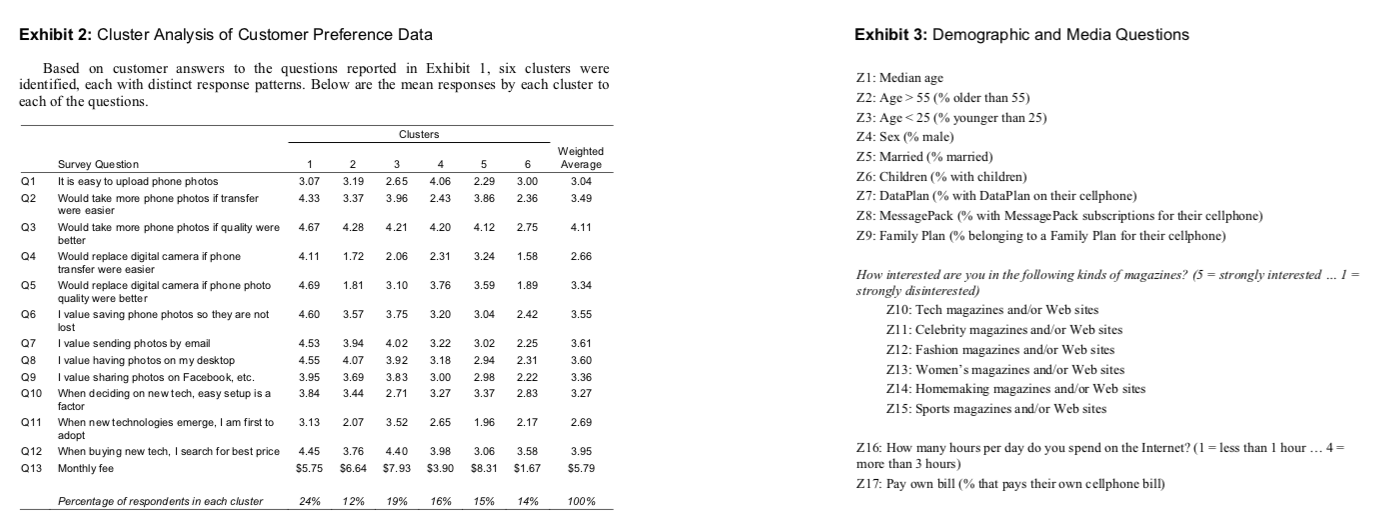
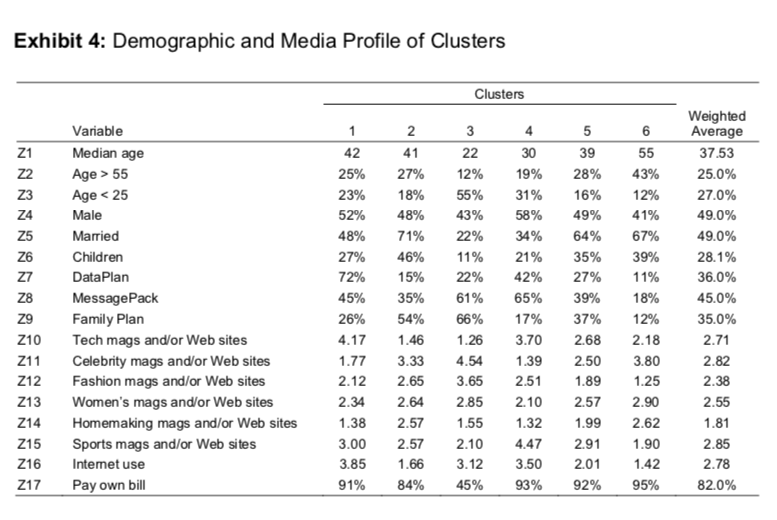
Ontela PicDeck (B): Customer Segmentation, Targeting, and Positioning The Quantitative Customer Segmentation Study Although Joe Levy felt that the customer persona provided a good starting point to begin thinking about PicDeck's segmentation, he believed that he needed quantitative data to get a more precise understanding of the relative attractiveness of different customer segments. This would require data on end users regarding their preferences and behaviors related to mobile devices and imaging. He therefore hired a market research firm to conduct a quantitative customer segmentation study. The firm conducted a national survey of 2,000 respondents who were selected from lists of mobile telephone customers aged 15 and older. The questions in the survey ranged from respondents' current mobile phone behavior and camera experience to general technology aptitude and price sensitivity. The survey questions are listed in Exhibit 1. The research firm used a random sampling approach to ensure that the respondent sample accurately represented nationwide wireless subscribers. Analysis of Customer Survey Data Identifying Segments-Cluster Analysis of Preference Data The research firm performed a cluster analysis on the responses. A cluster analysis is a statistical technique that identifies groups of customers who have similar survey response patterns. The number of clusters is determined in part by how different the response patterns are. If all survey respondents tend to give the same responses, then only one cluster is identified. For this survey, six clusters of respondents were identified, each with a different response pattern. Details of each cluster are provided in Exhibit 2, which lists the mean responses to each question for each cluster. Profiling Segments-Demographic and Media Choice Information Exhibit 1: Preference Questions in Segmentation Survey In addition to the preference data, the research firm also asked the same respondents a series these questions were intended to provide information about consumer perceptions of the of questions related to demographics and media habits. The demographics and media habi questions are shown in Exhibit 3, and the profiles of the six clusters are reported in Exhibit 4 . Exhibit 2: Cluster Analysis of Customer Preference Data Exhibit 3: Demographic and Media Questions Based on customer answers to the questions reported in Exhibit 1, six clusters were identified, each with distinct response patterns. Below are the mean responses by each cluster to Z1: Median age each of the questions. Z2: Age >55 (\% older than 55) Z3:AgeStep by Step Solution
There are 3 Steps involved in it

Get step-by-step solutions from verified subject matter experts