

Question: Based on data from 58 McDonald's breakfast and lunch/dinner menu items, use the histograms, boxplots, scatterplots, descriptive and summary statistics to analyze the following: Using
Based on data from 58 McDonald's breakfast and lunch/dinner menu items, use the histograms, boxplots, scatterplots, descriptive and summary statistics to analyze the following:
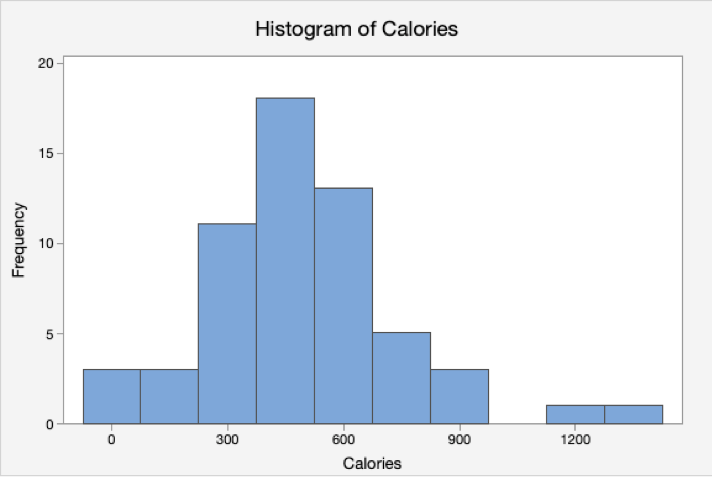
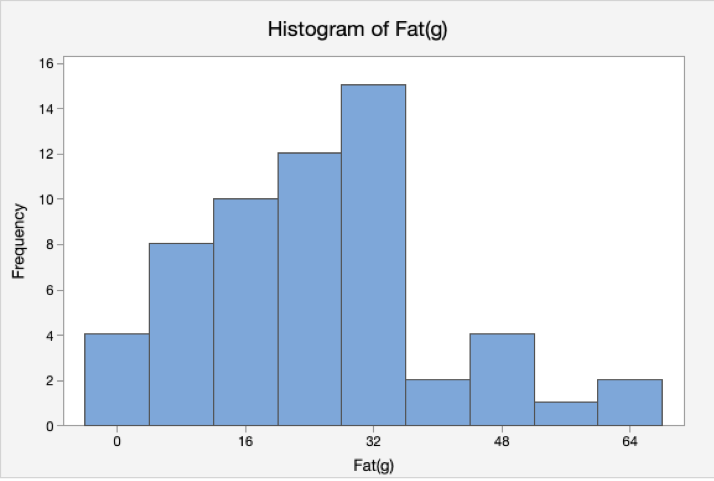
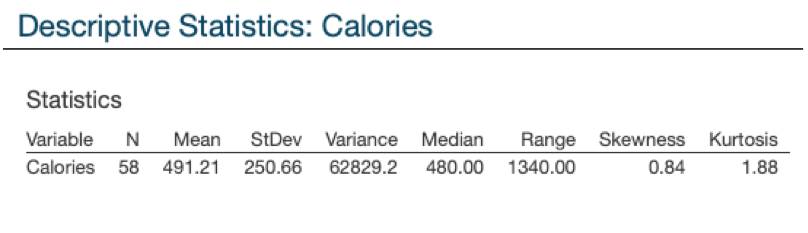
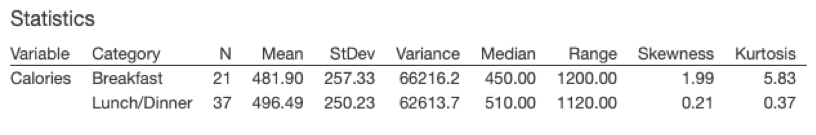
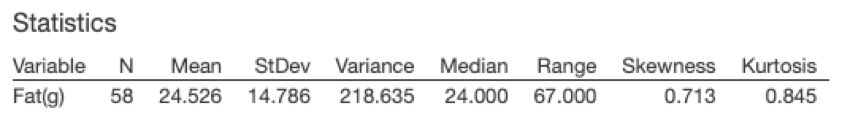
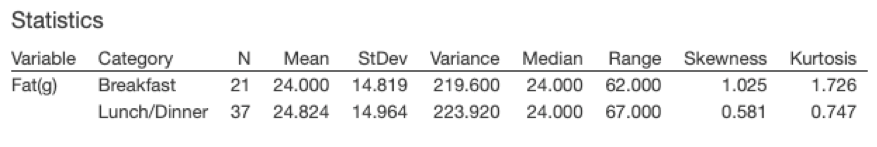
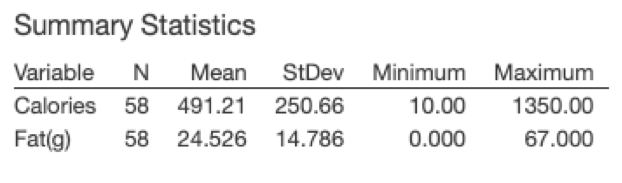
- Using the histograms, boxplots and descriptive statistics:
- Study the center (Mean and Median), dispersion (Standard Deviation and Range), distribution (Skew and Kurtosis), and position (re: outliers - if any and by what criteria) for each of the quantitative variables. Describe what these values tell you about each of the variables.
- Decide not only whether the data are symmetric or skewed, but whether the data are sufficiently symmetric to make the assumption of normality. Give your reasoning as well as stating your decision about the shape of the data.
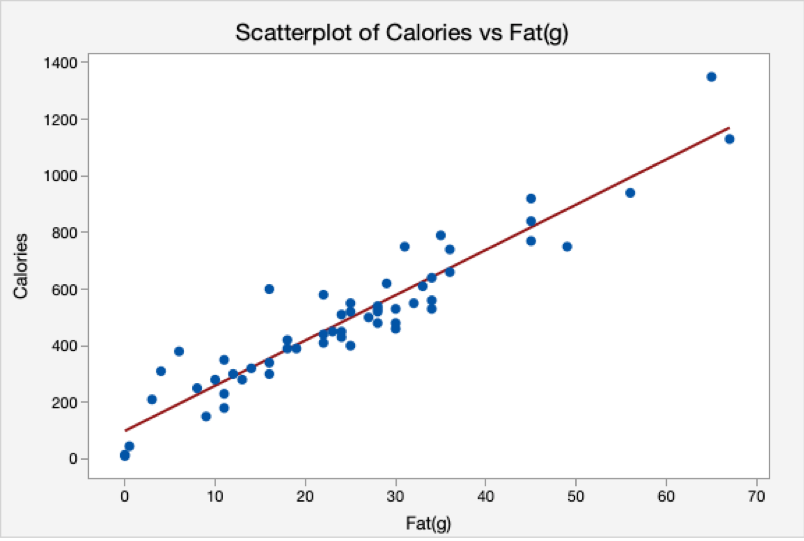
- Using the scatterplot and summary statistics:
- Decide if there is a significant linear relationship between the variables.
- Categorize the correlation as strong/weak/insignificant. If a strong or weak correlation exists categorize it as positive or negative.
- Analyze points in the scatter plot that appear not to follow the trend of the regression line. Try to discern why these points do not follow the trend and whether the points should be kept in the analysis.
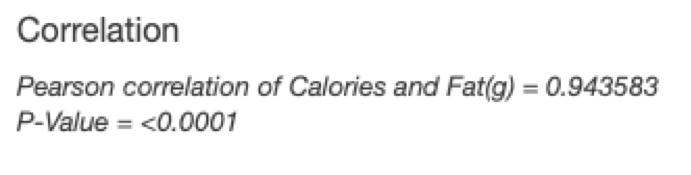
- Analyze numeric measures of correlation
- Explain the relevance of correlation coefficient, r
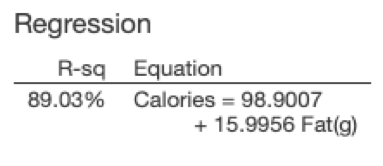
- Explain the relevance and practical meaning of R-squared
- Examine whether evidence of a relationship between two variable exists using the p-value
- Explain the relevance of the slope of regression line
- Prediction
- Find the linear regression equation.
- Elaborate on the reliability of predictions. Should the equation be used for predictive purposes?
- If appropriate, select a few values of the predictor variable and make the prediction using the regression equation. If not, explain what approach you would take to make predictions.
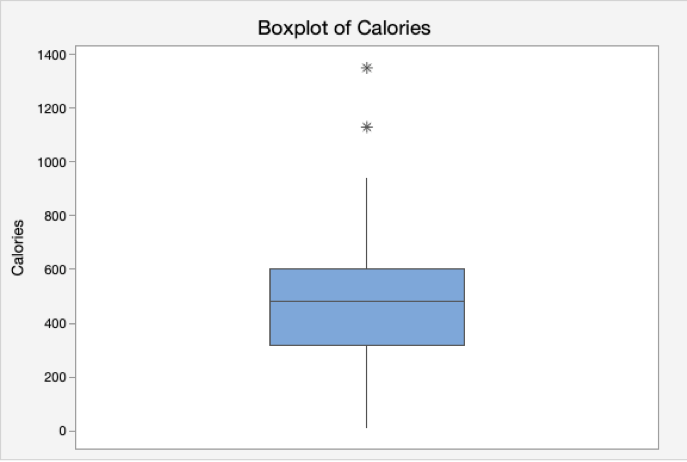
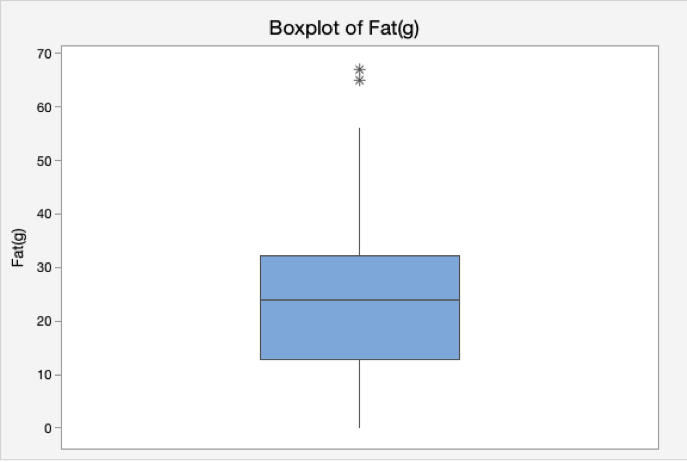
Boxplot of Calories 1400 1200 1000 800 O 600 400 200 Boxplot of Fat(g) 70- 60 50 40 L 30 20 10 Boxplot of Calories 1400 1200 1000 800 O 600 400 200 Boxplot of Fat(g) 70- 60 50 40 L 30 20 10
Step by Step Solution
There are 3 Steps involved in it
1 Expert Approved Answer
Step: 1 Unlock

Question Has Been Solved by an Expert!
Get step-by-step solutions from verified subject matter experts
Step: 2 Unlock
Step: 3 Unlock