

Question: Based on Exhibit 2 in the case, draw a chart to show a trend of each segment sales, using Excel. (Note: Copy & paste the
Based on Exhibit 2 in the case, draw a chart to show a trend of each segment sales, using Excel. (Note: Copy & paste the chart to the MS-Word file.)
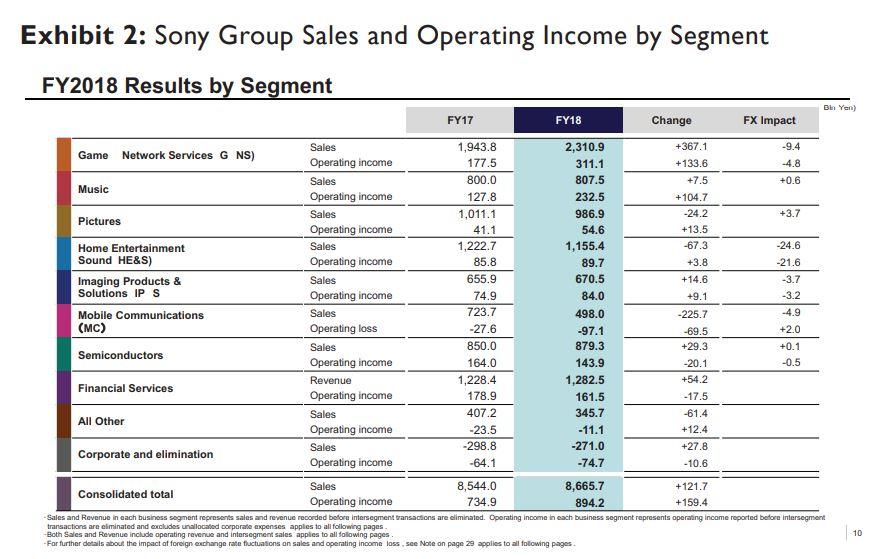
Exhibit 2: Sony Group Sales and Operating Income by Segment FY2018 Results by Segment Exhibit 2: Sony Group Sales and Operating Income by Segment FY2018 Results by Segment
Step by Step Solution
There are 3 Steps involved in it
1 Expert Approved Answer
Step: 1 Unlock

Question Has Been Solved by an Expert!
Get step-by-step solutions from verified subject matter experts
Step: 2 Unlock
Step: 3 Unlock