

Question: Based on Exhibit 2 in the case, draw a chart to show a trend of each segment sales, using Excel. Using the information from Exhibit
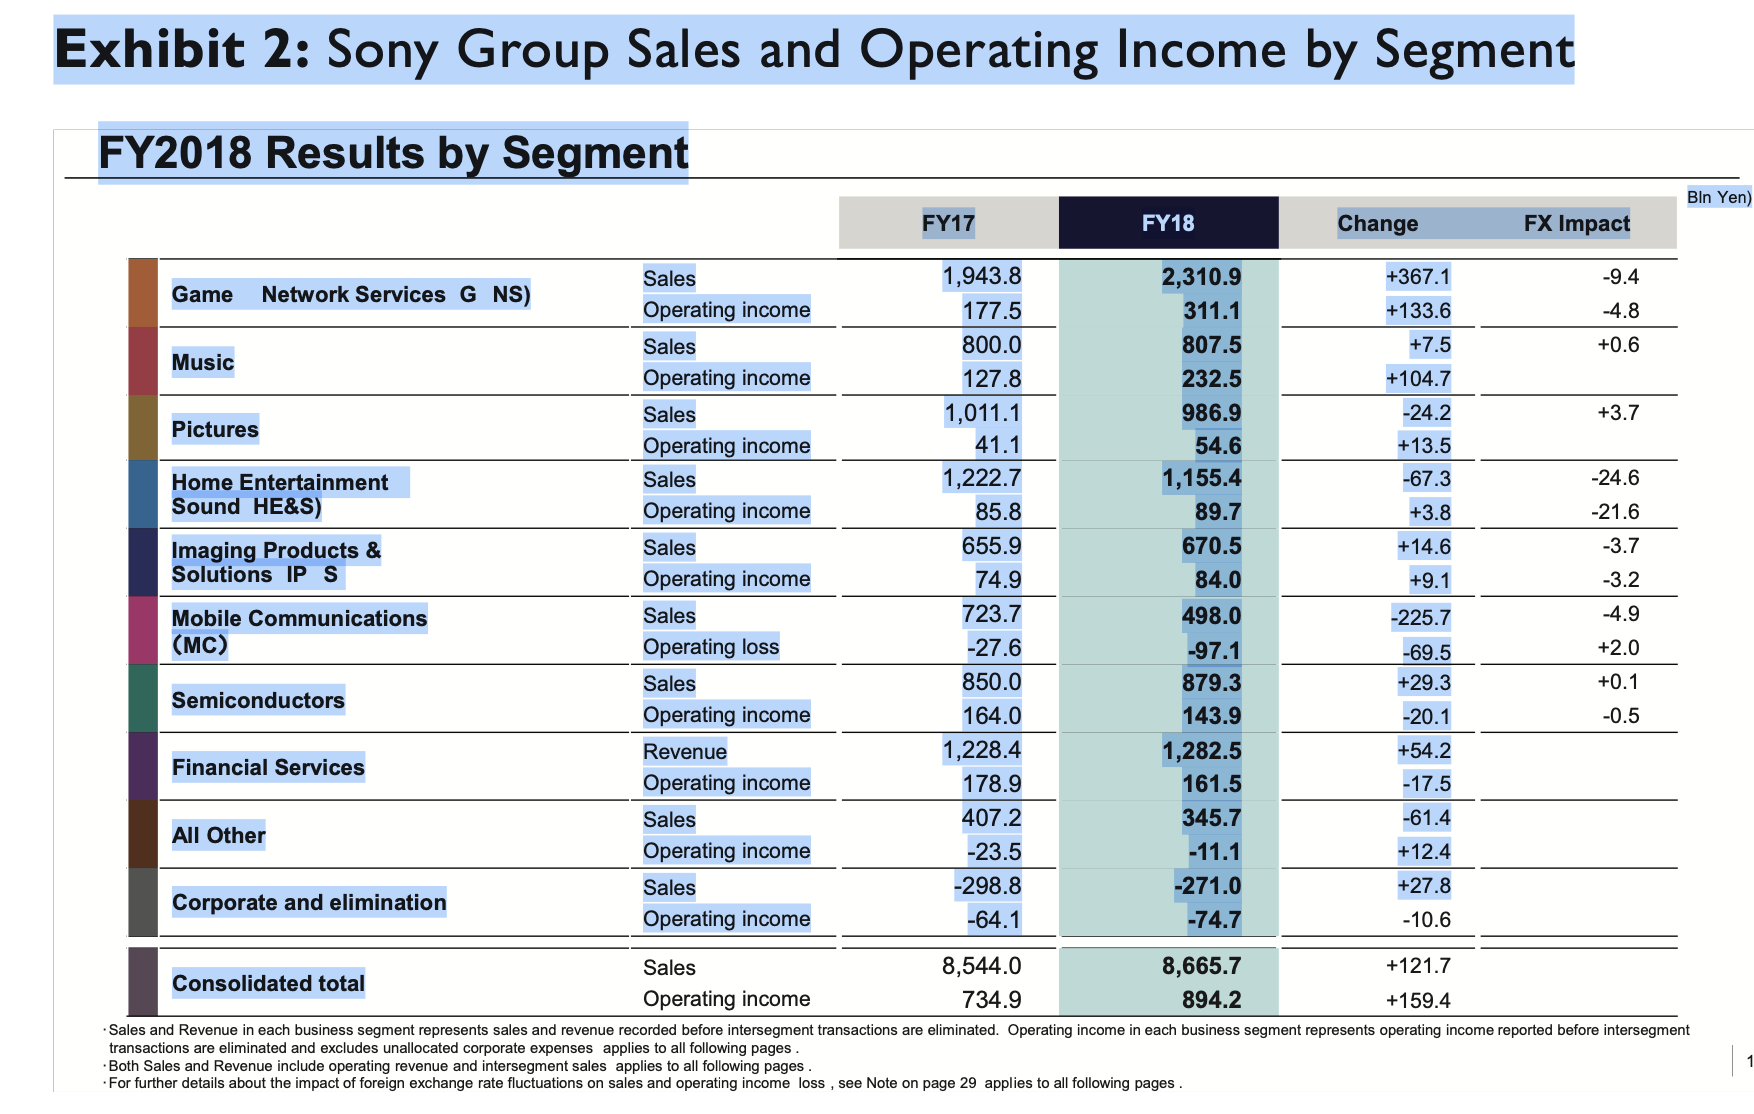
Based on Exhibit 2 in the case, draw a chart to show a trend of each segment sales, using Excel.
Using the information from Exhibit 2, (1) calculate the operating margin of each segment in 2017 and 2018 (2) identify which segment was the most profitable in 2017 and 2018, based on the operating margin. (Note: Operating margin = Operating income Sales)
xhibit 2: Sony Group Sales and Operating Income by Segment FY2018 Results by Segment Sa. transactions are eliminated and excludes unallocated corporate expenses applies to all following pages. Both Sales and Revenue include operating revenue and intersegment sales applies to all following page For further details about the impact of foreign exchange rate fluctuations on sales and operating ing
Step by Step Solution
There are 3 Steps involved in it

Get step-by-step solutions from verified subject matter experts