

Question: Based on least squared regression method find the projections for the years 2021, 2022, and 2023. Plot the number of sold cars versus years (points
- Based on least squared regression method find the projections for the years 2021, 2022, and 2023. Plot the number of sold cars versus years (points graph) and show the trend line based on your projections. (10%).
This is the whole question. Please give the formulas as well. Thankyou
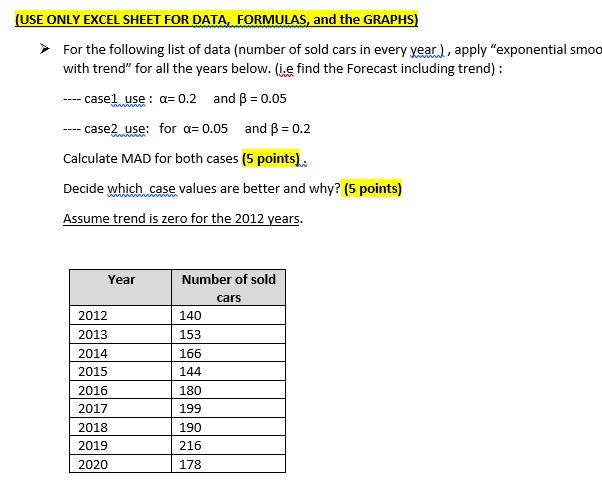
(USE ONLY EXCEL SHEET FOR DATA, FORMULAS, and the GRAPHS) > For the following list of data (number of sold cars in every year), apply "exponential smoo with trend" for all the years below. (i.e find the Forecast including trend) : ---- casel use: a=0.2 and B = 0.05 -- case2 use: for a= 0.05 and B = 0.2 Calculate MAD for both cases (5 points): Decide which case values are better and why? (5 points) Assume trend is zero for the 2012 years. Year 2012 2013 2014 2015 2016 2017 Number of sold cars 140 153 166 144 180 199 2018 2019 2020 190 216 178Step by Step Solution
There are 3 Steps involved in it
1 Expert Approved Answer
Step: 1 Unlock

Question Has Been Solved by an Expert!
Get step-by-step solutions from verified subject matter experts
Step: 2 Unlock
Step: 3 Unlock