

Question: based on part 1 to answer part 2, use python to find the following and calculate the proportion in which PUMAs, the median income of
based on part 1 to answer part 2, use python to find the following and calculate the proportion
in which PUMAs, the median income of R65=0> R65=1 and R65=2
the median income of R65=1> R65=0 and R65=2
the median income of R65=2> R65=1 and R65=0
write down the code
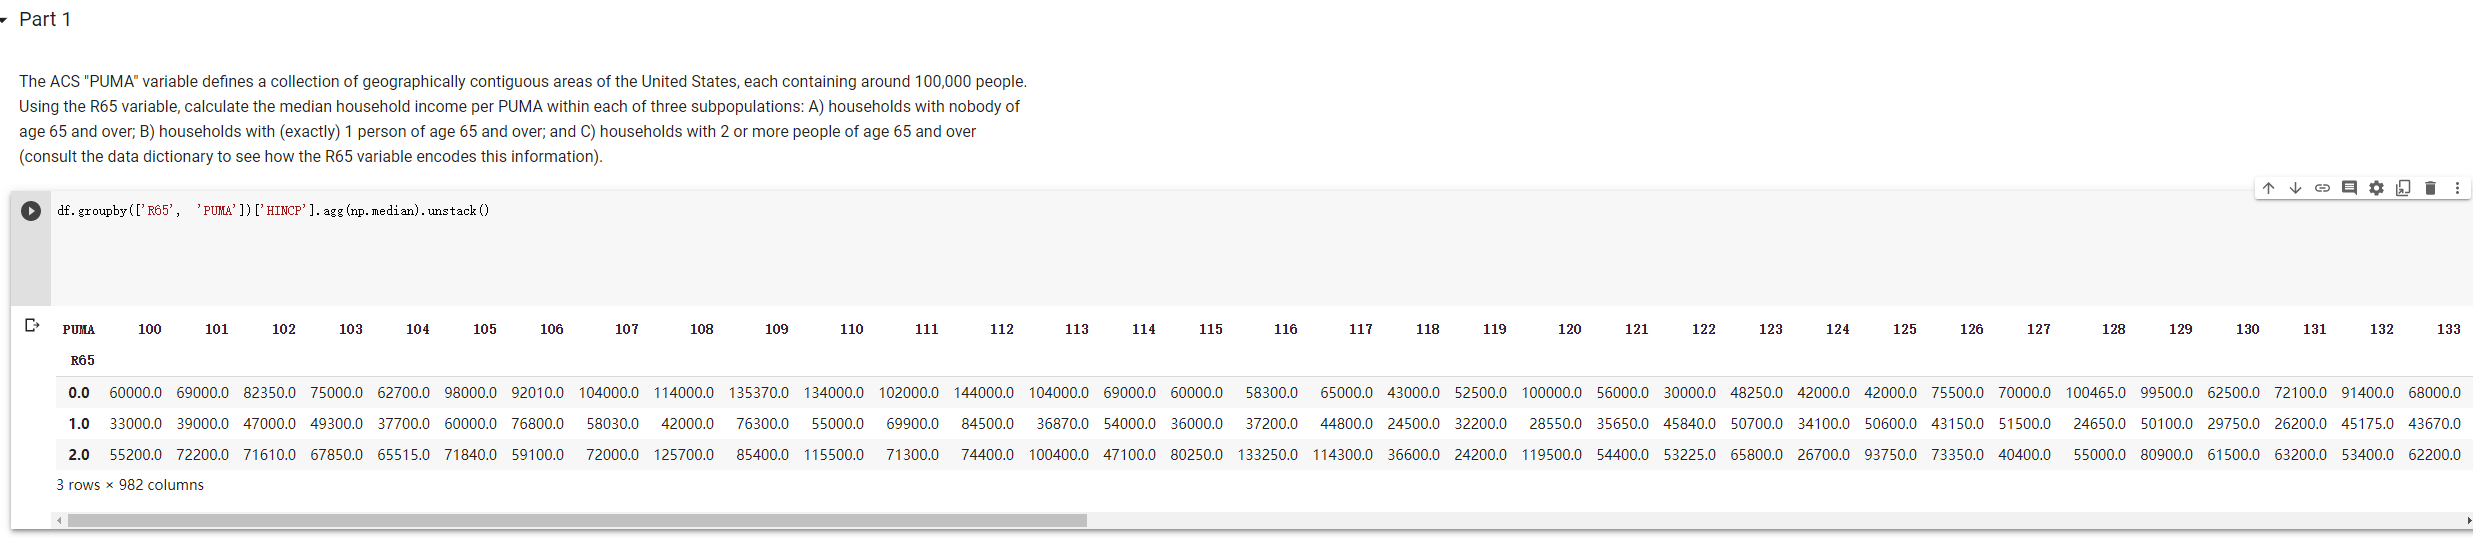
Part 1 The ACS "PUMA" variable defines a collection of geographically contiguous areas of the United States, each containing around 100,000 people. Using the R65 variable, calculate the median household income per PUMA within each of three subpopulations: A) households with nobody of age 65 and over; B) households with (exactly) 1 person of age 65 and over; and C) households with 2 or more people of age 65 and over (consult the data dictionary to see how the R65 variable encodes this information). ta df. groupby ( ['R65', PUMA']) ['HINCP'). agg (np. median). unstack() PUMA 100 101 102 103 104 105 106 107 108 109 110 111 112 113 114 115 116 117 118 119 120 121 122 123 124 125 126 127 128 129 130 131 132 133 R65 0.0 60000.0 69000.0 82350.0 75000.0 62700.0 98000.0 92010.0 104000.0 114000.0 135370.0 134000.0 102000.0 144000.0 104000.0 69000.0 60000.0 58300.0 65000.0 43000.0 52500.0 100000.0 56000.0 30000.0 48250.0 42000.0 42000.0 75500.0 70000.0 100465.0 99500.0 62500.0 72100.0 91400.0 68000.0 1.0 33000.0 39000.0 47000.0 49300.0 37700.0 60000.0 76800.0 58030.0 42000.0 76300.0 55000.0 69900.0 84500.0 36870.0 54000.0 36000.0 37200.0 44800.0 24500.0 32200.0 28550.0 35650.0 45840.0 50700.0 34100.0 50600.0 43150.0 51500.0 24650.0 50100.0 29750.0 26200.0 45175.0 43670.0 2.0 55200.0 72200.0 71610.0 67850.0 65515.0 71840.0 59100.0 72000.0 125700.0 85400.0 115500.0 71300.0 74400.0 100400.0 47100.0 80250.0 133250.0 114300.0 36600.0 24200.0 119500.0 54400.0 53225.0 65800.0 26700.0 93750.0 73350.0 40400.0 55000.0 80900.0 61500.0 63200.0 53400.0 62200.0 3 rows x 982 columns Part 2 In what proportion of the PUMAs does group A have the highest median household income among the three groups? In what proportion does group B have the highest median household income? Group C? [1691 Part 1 The ACS "PUMA" variable defines a collection of geographically contiguous areas of the United States, each containing around 100,000 people. Using the R65 variable, calculate the median household income per PUMA within each of three subpopulations: A) households with nobody of age 65 and over; B) households with (exactly) 1 person of age 65 and over; and C) households with 2 or more people of age 65 and over (consult the data dictionary to see how the R65 variable encodes this information). ta df. groupby ( ['R65', PUMA']) ['HINCP'). agg (np. median). unstack() PUMA 100 101 102 103 104 105 106 107 108 109 110 111 112 113 114 115 116 117 118 119 120 121 122 123 124 125 126 127 128 129 130 131 132 133 R65 0.0 60000.0 69000.0 82350.0 75000.0 62700.0 98000.0 92010.0 104000.0 114000.0 135370.0 134000.0 102000.0 144000.0 104000.0 69000.0 60000.0 58300.0 65000.0 43000.0 52500.0 100000.0 56000.0 30000.0 48250.0 42000.0 42000.0 75500.0 70000.0 100465.0 99500.0 62500.0 72100.0 91400.0 68000.0 1.0 33000.0 39000.0 47000.0 49300.0 37700.0 60000.0 76800.0 58030.0 42000.0 76300.0 55000.0 69900.0 84500.0 36870.0 54000.0 36000.0 37200.0 44800.0 24500.0 32200.0 28550.0 35650.0 45840.0 50700.0 34100.0 50600.0 43150.0 51500.0 24650.0 50100.0 29750.0 26200.0 45175.0 43670.0 2.0 55200.0 72200.0 71610.0 67850.0 65515.0 71840.0 59100.0 72000.0 125700.0 85400.0 115500.0 71300.0 74400.0 100400.0 47100.0 80250.0 133250.0 114300.0 36600.0 24200.0 119500.0 54400.0 53225.0 65800.0 26700.0 93750.0 73350.0 40400.0 55000.0 80900.0 61500.0 63200.0 53400.0 62200.0 3 rows x 982 columns Part 2 In what proportion of the PUMAs does group A have the highest median household income among the three groups? In what proportion does group B have the highest median household income? Group C? [1691
Step by Step Solution
There are 3 Steps involved in it

Get step-by-step solutions from verified subject matter experts