

Question: I need assistance with the script. Theres are several steps. 1. Part I: Descriptive Statistics (Scenario A) Scenario A: National Weather Service Note: The following
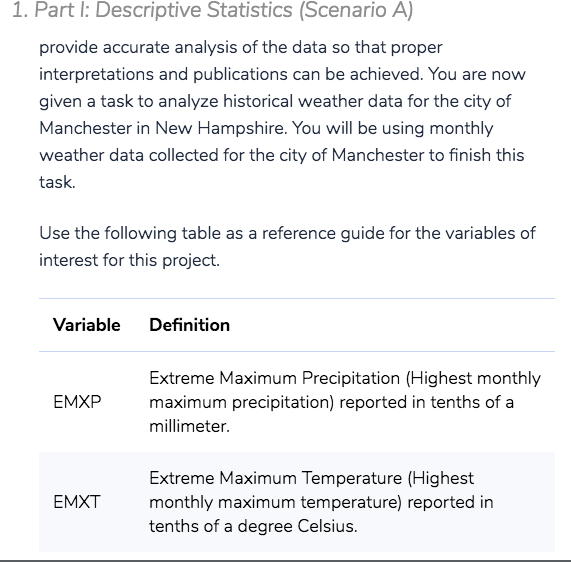
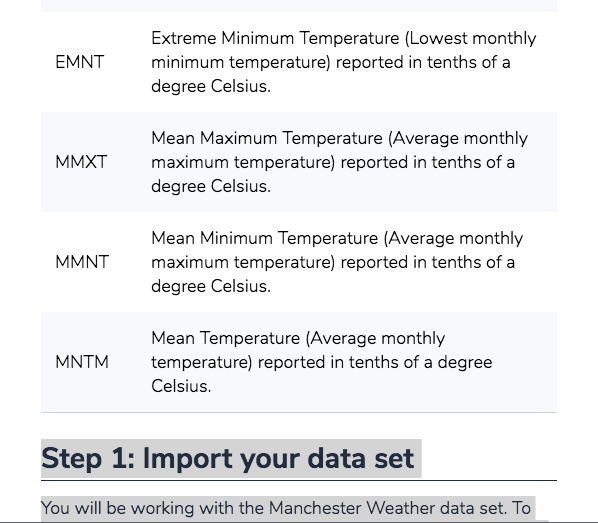
I need assistance with the script. Theres are several steps. 1. Part I: Descriptive Statistics (Scenario A) Scenario A: National Weather Service Note: The following information and instructions apply to students that have been assigned to Scenario A by the instructor. You can find your scenario assignment in the Final Project Review and Scenario Assignments item in the Module One area of the course. Reach out to your instructor if you have questions about your scenario assignment. If you run into issues and would like to start over with a clean copy of the provided script file (e.g., Milestone1.py), you can click on the gear button, and select Restore current files from the drop-down menu. Imagine you are a data analyst working at the National Weather Service. Your primary job is to analyze historical weather data for regions within the United States collected by the agency. Your analysis will lead to updating important weather pattern models based on historical trends and your findings will be published in academic journals. As you can see, it is critical for an analyst to provide accurate analysis of the data so that proper interpretations and publications can be achieved. You are now given a task to analyze historical weather data for the city of Manchester in New Hampshire. You will be using monthly weather data collected for the city of Manchester to finish this task. Use the following table as a reference guide for the variables of interest for this project. Variable Definition EMXP Extreme Maximum Precipitation (Highest monthly maximum precipitation) reported in tenths of a millimeter. EMXT Extreme Maximum Temperature (Highest monthly maximum temperature) reported in tenths of a degree Celsius. EMNT Extreme Minimum Temperature (Lowest monthly minimum temperature) reported in tenths of a degree Celsius. MMXT Mean Maximum Temperature (Average monthly maximum temperature) reported in tenths of a degree Celsius. MMNT Mean Minimum Temperature (Average monthly maximum temperature) reported in tenths of a degree Celsius. MNTM Mean Temperature (Average monthly temperature) reported in tenths of a degree Celsius. Step 1: Import your data set You will be working with the Manchester Weather data set. To ensure that you analyze the correct data set, make the following edits to the function underneath Step 1: Import your data set in the Tool Panel on the left side of the screen.
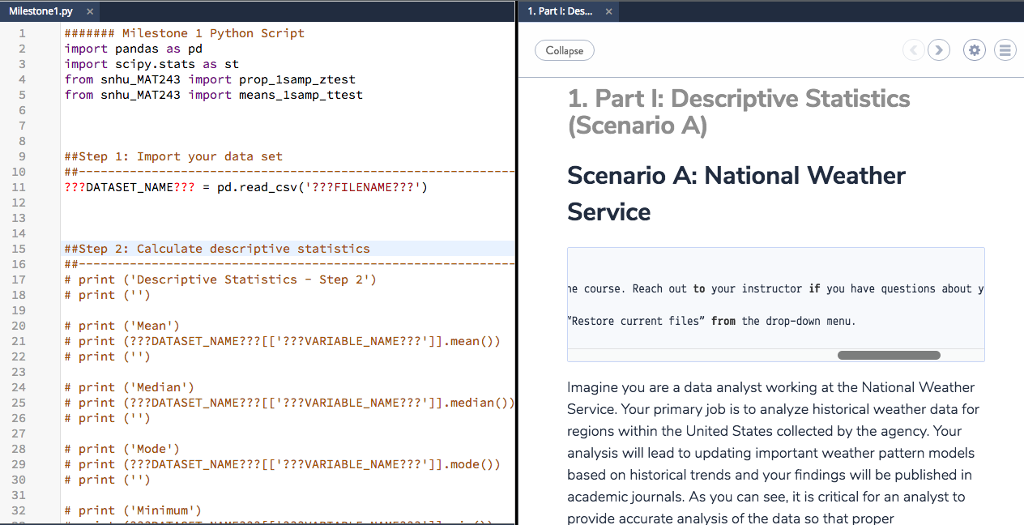
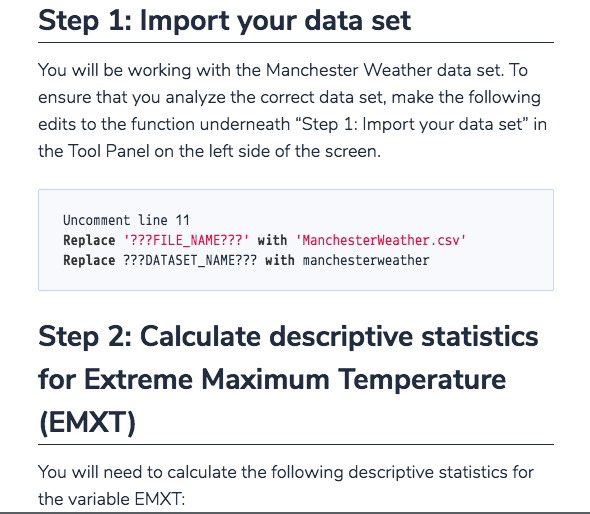
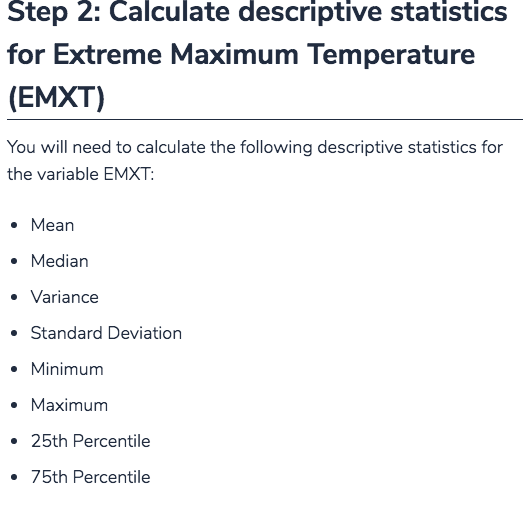
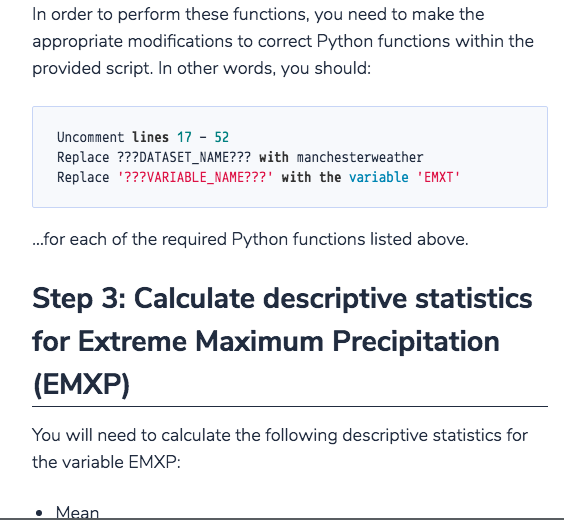
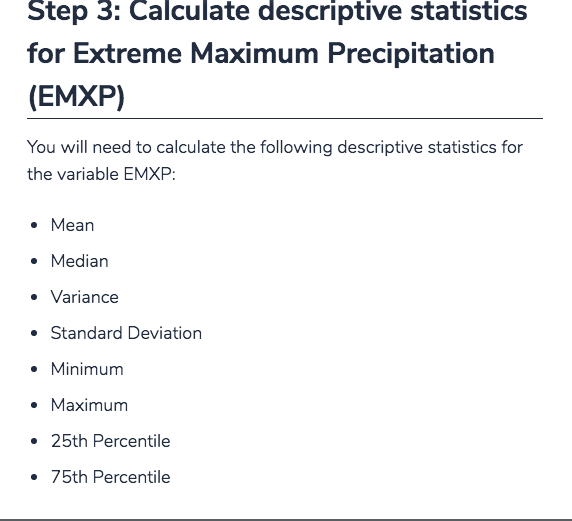
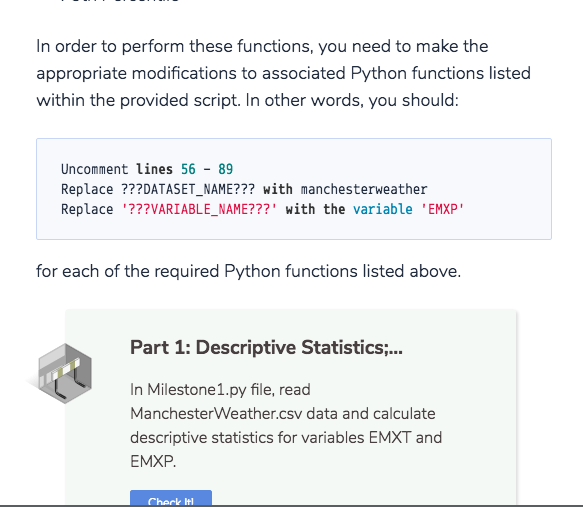
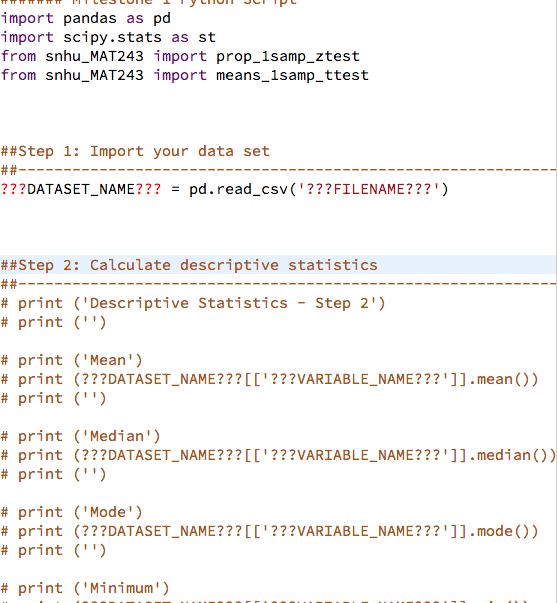
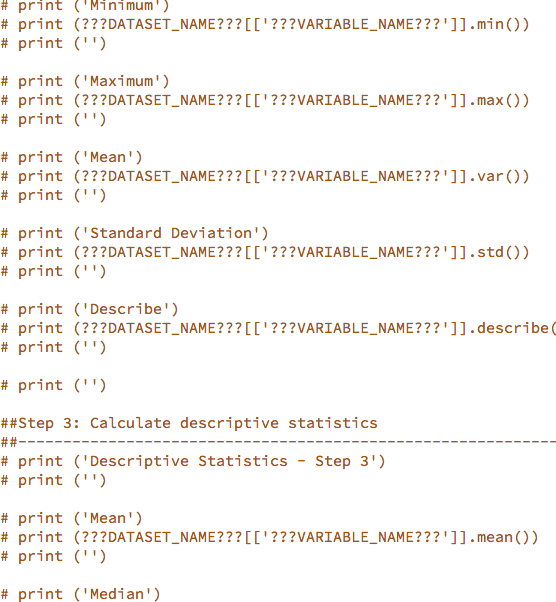
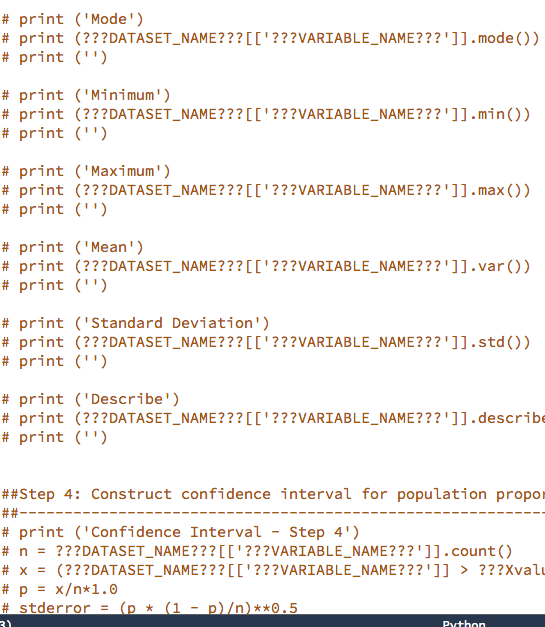
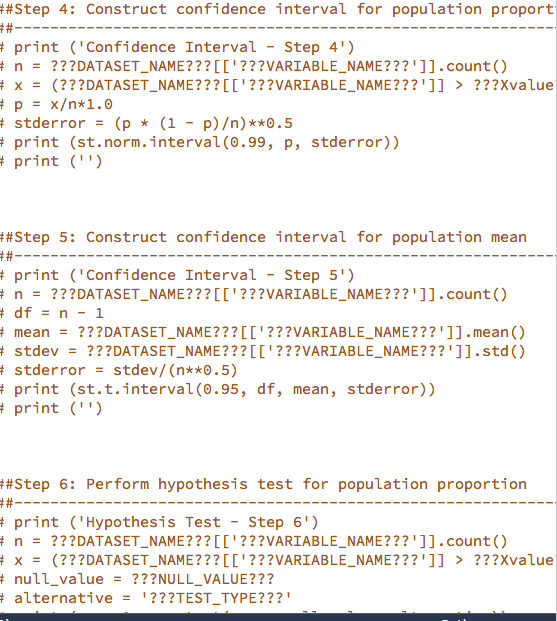
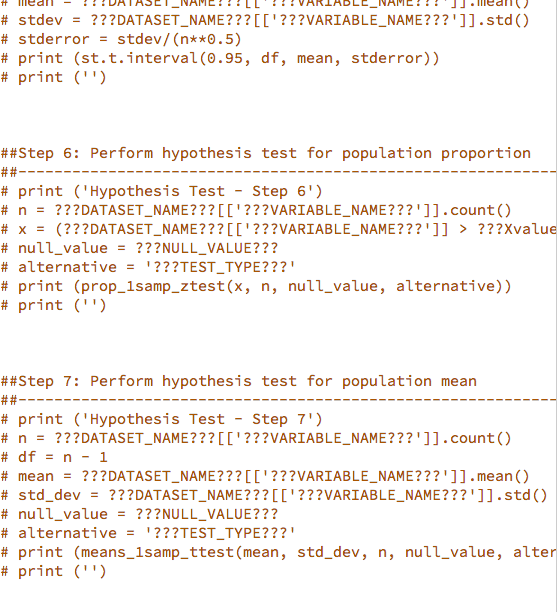
Milestone1.py x 1, Part 1: Des import pandas as pd import scipy.stats as st from snhu_MAT243 import prop_1samp_ztest from snhu_MAT243 import means_lsamp_ttest Collapse 4 1. Part l: Descriptive Statistics 7 8 9 10 11 12 13 14 15 Scenario A) Scenario A: National Weather Service ##Step 1: Import your data set ???DATASET-NAME??? pd.read_csv('???FILENAME???') = ##Step 2: Calculate descriptive statistics # print ("Descriptive Statistics - Step 2') # print ('') 17 18 19 20 21 course. Reach out to your instructor if you have questions about y Restore current files" from the drop-down menu # print ('Mean') #print # print ('') (???DATASET-NAME???[['??VARIABLE-NAME???']].mean()) 23 24 25 26 27 28 29 30 31 32 # print # ('Median') (???DATASET-NAME???[[ '???VARIABLE-NAME???' ]].medi an()) ('') Imagine you are a data analyst working at the National Weather Service. Your primary job is to analyze historical weather data for regions within the United States collected by the agency. Your analysis will lead to updating important weather pattern models based on historical trends and your findings will be published in academic journals. As you can see, it is critical for an analyst to provide accurate analysis of the data so that proper print # print # print ('Mode') #print # print ('') (???DATASET-NAME???[[ '???VARIABLE-NAME???' ]].mode()) # print ('Minimum') 1. Part l: Descriptive Statistics (Scenario A) provide accurate analysis of the data so that proper interpretations and publications can be achieved. You are now given a task to analyze historical weather data for the city of Manchester in New Hampshire. You will be using monthly weather data collected for the city of Manchester to finish this task. Use the following table as a reference guide for the variables of interest for this project Variable Definition Extreme Maximum Precipitation (Highest monthly maximum precipitation) reported in tenths of a millimeter EMXP Extreme Maximum Temperature (Highest monthly maximum temperature) reported in tenths of a degree Celsius. EMXT Extreme Minimum Temperature (Lowest monthly minimum temperature) reported in tenths of a degree Celsius. EMNT Mean Maximum Temperature (Average monthly maximum temperature) reported in tenths of a degree Celsius. MMXT Mean Minimum Temperature (Average monthly maximum temperature) reported in tenths of a degree Celsius. MMNT Mean Temperature (Average monthly temperature) reported in tenths of a degree Celsius MNTM Step 1: Import your data set You will be working with the Manchester Weather data set. To Step 1: Import your data set You will be working with the Manchester Weather data set. To ensure that you analyze the correct data set, make the following edits to the function underneath "Step 1: Import your data set" irn the Tool Panel on the left side of the screen. Uncomment line 11 Replace???FILE_NAME???' with 'ManchesterWeather.csv' Replace ???DATASET_NAME??? with manchesterweather Step 2: Calculate descriptive statistics for Extreme Maximum Temperature (EMXT) You will need to calculate the following descriptive statistics for the variable EMXT: Step 2: Calculate descriptive statistics for Extreme Maximum Temperature (EMXT) You will need to calculate the following descriptive statistics for the variable EMXT . Mean . Median Variance Standard Deviation . Minimum Maximum 25th Percentile 75th Percentile In order to perform these functions, you need to make the appropriate modifications to correct Python functions within the provided script. In other words, you should: Uncomment lines 17 52 Replace???DATASET_NAME??? with manchesterweather Replace '???VARIABLE_NAME???' with the variable 'EMXT' for each of the required Python functions listed above Step 3: Calculate descriptive statistics for Extreme Maximum Precipitation (EMXP) You will need to calculate the following descriptive statistics for the variable EMXP: Mean Step 3: Calculate descriptive statistics for Extreme Maximum Precipitation (EMXP) You will need to calculate the following descriptive statistics for the variable EMXP: . Mean . Median Variance Standard Deviation . Minimum Maximum 25th Percentile 75th Percentile In order to perform these functions, you need to make the appropriate modifications to associated Python functions listed within the provided script. In other words, you should: Uncomment lines 56 -89 Replace???DATASET_NAME??? with manchesterweather Replace ???VARIABLE NAME???" with the variable 'EMXP for each of the required Python functions listed above. Part 1: Descriptive Statistics... In Milestone1.py file, read Manchester Weather.csv data and calculate descriptive statistics for variables EMXT and EMXP Cherk tl import pandas as pd import scipy.stats as st from snhu_MAT243 import prop_1samp ztest from snhu_MAT243 import means_1samp_ttest ##Step 1: Import your data set ???DATASET-NAME??? pd.read_csv ('???FILENAME???") ##Step 2: Calculate descriptive statistics # print ("Descriptive statistics - Step 2') # print ('') # print # print # print ('Mean') (???DATASET-NAME???[[' ???VARIABLE-NAME???' ]].mean()) ('') # print # print # print ('Median') (???DATASET-NAME???[[' ???VARIABLE-NAME???']].median()) ('') # print # print # print ('Mode') (???DATASET-NAME???[[' ???VARIABLE-NAME???']].mode()) ('') # print ('Minimum') # print # print # print ("Mininum') (???DATASET, NAME???[['???VARIABLE-NAME???"]].min()) ('') # print # print # print ("Maximum!) (???DATASET. NAM E ? ? ? [['???VARIABLE-NAME???"]].max()) ('') # print # print # print ('Mean') (???DATASET. NAM E ? ? ? [['???VARIABLE-NAME???"]].var()) ('') # print # print # print ('Standard Deviation') (???DATASET. NAM E ? ? ? [['???VARIABLE-NAME???"]].std()) ('') print # # ('Describe') print # (???DATAS ET,NAME??? [['???VARIABLE-NAME???"]].describe( print # print ('') ##Step 3: Calculate descriptive statistics ('') # print ('Descriptive Statistics - Step 3') # print ('') # print # print # print ('Mean') (???DATASET. NAME???[['???VARIABLE-NAME???"]].mean()) ('') # print ('Median') # print # print # print ('Mode') (???DATASET. NAM E ? ? ? [['???VARIABLE-NAME???"]].mode()) ('') print ('Minimum) # print (???DATASET. NAM E ? ? ? [['???VARIABLE-NAME???"]].min()) # print ('') # print # print # print ('Maximum ') (???DATASET. NAM E ? ? ? [['???VARIABLE-NAME???"]].max()) ('') # print # print # print ('Mean') (???DATASET. NAM E ? ? ? [['???VARIABLE-NAME???"]].var()) ('') # print # print # print ('Standard Deviation') (???DATASET. NAM E ? ? ? [['???VARIABLE-NAME???"]].std()) ('') # print # print # print ('Describe') (???DATAS ET,NAME???[['???VARIABLE-NAME???"]].describe ('') ##Step 4: Construct confidence interval for population propo print ('Confidence Interval - Step 4') n ???DATASET-NAM E ?? ? [['???VARIABLE-NAME???"]].count() x (???DATASET-NAME???[[' ???VARIABLE-NAME???']] > ???Xval' # # # # stderror = (p * (1 p))**0.5 - Step 4: Construct confidence interval for population proport t print ('Confidence Interval Step 4') # n ???DATASET-NAME???[[' ???VARIABLE-NAME???' ]].count() x = (???DATASET-NAME???[[' ???VARIABLE-NAME???']] p = x+1.0 stderror = (p * (1 - p))**0.5 > ??7xvalue tprint (st.norm.interval(0.99, p, stderror)) print (") Step 5: Construct confidence interval for population mean t print ('Confidence Interval Step 5') n-???DATASET_NAME???'???VARIABLE_NAME???']].count() df = n-1 mean = ???DATASET-NAME??? [['???VARIABLE-NAME???' ]].mean() stdev = ???DATASET-NAME??? [['???VARIABLE-NAME???' ]].std() t stderror - stdev/ (n**0.5) print (st.t.interval (0.95, df, mean, stderror)) print (") Step 6: Perform hypothesis test for population proportion print ("Hypothesis Test - Step 61) # ???DATASET-NAME???[[' ???VARIABLE-NAME???' ]].count() n x(?2??DATASET NAME???L'???VARIABLE NAME??? '1] nullvalue ???NULLVALUE??? alternative = '???TESTTYPE???! ???Xvalue - - - # # # # stdev ???DATASET-NAME??? [['???VARIABLE-NAME???' ]].std() stderror = stdev/ (n**0.5) print (st . t . interval (0.95, df, mean, stderror)) print ('') ##Step 6: Perform hypothesis test for population proportion print (Hypothesis Test- Step 6') n = ???DATASET-NAME??? [['???VARIABLE-NAME???' ]].count() x = (???DATASET-NAME???[[' ???VARIABLE-NAME???']] > ??TXvalue nulivalue = ???NULLVALUE??? alternative = '???TEST-TYPE???! print (prop-1samp_ztest(x, n, null-value, alternative)) print ('') # # # # # # # - - ##Step 7: Perform hypothesis test for population mean # print (Hypothesis Test- Step 7') # n = ???DATASET-NAME??? [['???VARIABLE-NAME???' ]].count() #df = n-1 # mean ???DATASET-NAME???[[' ???VARIABLE-NAME???' ]].mean() # std-dev ???DATASET-NAME??? [['???VARIABLE-NAME???' ]].std() # nulivalue = ???NULLVALUE??? # alternative = '???TEST-TYPE???! # print (means-1samp-ttest(mean, std-dev, n, null-value, alter # print ('') - - Milestone1.py x 1, Part 1: Des import pandas as pd import scipy.stats as st from snhu_MAT243 import prop_1samp_ztest from snhu_MAT243 import means_lsamp_ttest Collapse 4 1. Part l: Descriptive Statistics 7 8 9 10 11 12 13 14 15 Scenario A) Scenario A: National Weather Service ##Step 1: Import your data set ???DATASET-NAME??? pd.read_csv('???FILENAME???') = ##Step 2: Calculate descriptive statistics # print ("Descriptive Statistics - Step 2') # print ('') 17 18 19 20 21 course. Reach out to your instructor if you have questions about y Restore current files" from the drop-down menu # print ('Mean') #print # print ('') (???DATASET-NAME???[['??VARIABLE-NAME???']].mean()) 23 24 25 26 27 28 29 30 31 32 # print # ('Median') (???DATASET-NAME???[[ '???VARIABLE-NAME???' ]].medi an()) ('') Imagine you are a data analyst working at the National Weather Service. Your primary job is to analyze historical weather data for regions within the United States collected by the agency. Your analysis will lead to updating important weather pattern models based on historical trends and your findings will be published in academic journals. As you can see, it is critical for an analyst to provide accurate analysis of the data so that proper print # print # print ('Mode') #print # print ('') (???DATASET-NAME???[[ '???VARIABLE-NAME???' ]].mode()) # print ('Minimum') 1. Part l: Descriptive Statistics (Scenario A) provide accurate analysis of the data so that proper interpretations and publications can be achieved. You are now given a task to analyze historical weather data for the city of Manchester in New Hampshire. You will be using monthly weather data collected for the city of Manchester to finish this task. Use the following table as a reference guide for the variables of interest for this project Variable Definition Extreme Maximum Precipitation (Highest monthly maximum precipitation) reported in tenths of a millimeter EMXP Extreme Maximum Temperature (Highest monthly maximum temperature) reported in tenths of a degree Celsius. EMXT Extreme Minimum Temperature (Lowest monthly minimum temperature) reported in tenths of a degree Celsius. EMNT Mean Maximum Temperature (Average monthly maximum temperature) reported in tenths of a degree Celsius. MMXT Mean Minimum Temperature (Average monthly maximum temperature) reported in tenths of a degree Celsius. MMNT Mean Temperature (Average monthly temperature) reported in tenths of a degree Celsius MNTM Step 1: Import your data set You will be working with the Manchester Weather data set. To Step 1: Import your data set You will be working with the Manchester Weather data set. To ensure that you analyze the correct data set, make the following edits to the function underneath "Step 1: Import your data set" irn the Tool Panel on the left side of the screen. Uncomment line 11 Replace???FILE_NAME???' with 'ManchesterWeather.csv' Replace ???DATASET_NAME??? with manchesterweather Step 2: Calculate descriptive statistics for Extreme Maximum Temperature (EMXT) You will need to calculate the following descriptive statistics for the variable EMXT: Step 2: Calculate descriptive statistics for Extreme Maximum Temperature (EMXT) You will need to calculate the following descriptive statistics for the variable EMXT . Mean . Median Variance Standard Deviation . Minimum Maximum 25th Percentile 75th Percentile In order to perform these functions, you need to make the appropriate modifications to correct Python functions within the provided script. In other words, you should: Uncomment lines 17 52 Replace???DATASET_NAME??? with manchesterweather Replace '???VARIABLE_NAME???' with the variable 'EMXT' for each of the required Python functions listed above Step 3: Calculate descriptive statistics for Extreme Maximum Precipitation (EMXP) You will need to calculate the following descriptive statistics for the variable EMXP: Mean Step 3: Calculate descriptive statistics for Extreme Maximum Precipitation (EMXP) You will need to calculate the following descriptive statistics for the variable EMXP: . Mean . Median Variance Standard Deviation . Minimum Maximum 25th Percentile 75th Percentile In order to perform these functions, you need to make the appropriate modifications to associated Python functions listed within the provided script. In other words, you should: Uncomment lines 56 -89 Replace???DATASET_NAME??? with manchesterweather Replace ???VARIABLE NAME???" with the variable 'EMXP for each of the required Python functions listed above. Part 1: Descriptive Statistics... In Milestone1.py file, read Manchester Weather.csv data and calculate descriptive statistics for variables EMXT and EMXP Cherk tl import pandas as pd import scipy.stats as st from snhu_MAT243 import prop_1samp ztest from snhu_MAT243 import means_1samp_ttest ##Step 1: Import your data set ???DATASET-NAME??? pd.read_csv ('???FILENAME???") ##Step 2: Calculate descriptive statistics # print ("Descriptive statistics - Step 2') # print ('') # print # print # print ('Mean') (???DATASET-NAME???[[' ???VARIABLE-NAME???' ]].mean()) ('') # print # print # print ('Median') (???DATASET-NAME???[[' ???VARIABLE-NAME???']].median()) ('') # print # print # print ('Mode') (???DATASET-NAME???[[' ???VARIABLE-NAME???']].mode()) ('') # print ('Minimum') # print # print # print ("Mininum') (???DATASET, NAME???[['???VARIABLE-NAME???"]].min()) ('') # print # print # print ("Maximum!) (???DATASET. NAM E ? ? ? [['???VARIABLE-NAME???"]].max()) ('') # print # print # print ('Mean') (???DATASET. NAM E ? ? ? [['???VARIABLE-NAME???"]].var()) ('') # print # print # print ('Standard Deviation') (???DATASET. NAM E ? ? ? [['???VARIABLE-NAME???"]].std()) ('') print # # ('Describe') print # (???DATAS ET,NAME??? [['???VARIABLE-NAME???"]].describe( print # print ('') ##Step 3: Calculate descriptive statistics ('') # print ('Descriptive Statistics - Step 3') # print ('') # print # print # print ('Mean') (???DATASET. NAME???[['???VARIABLE-NAME???"]].mean()) ('') # print ('Median') # print # print # print ('Mode') (???DATASET. NAM E ? ? ? [['???VARIABLE-NAME???"]].mode()) ('') print ('Minimum) # print (???DATASET. NAM E ? ? ? [['???VARIABLE-NAME???"]].min()) # print ('') # print # print # print ('Maximum ') (???DATASET. NAM E ? ? ? [['???VARIABLE-NAME???"]].max()) ('') # print # print # print ('Mean') (???DATASET. NAM E ? ? ? [['???VARIABLE-NAME???"]].var()) ('') # print # print # print ('Standard Deviation') (???DATASET. NAM E ? ? ? [['???VARIABLE-NAME???"]].std()) ('') # print # print # print ('Describe') (???DATAS ET,NAME???[['???VARIABLE-NAME???"]].describe ('') ##Step 4: Construct confidence interval for population propo print ('Confidence Interval - Step 4') n ???DATASET-NAM E ?? ? [['???VARIABLE-NAME???"]].count() x (???DATASET-NAME???[[' ???VARIABLE-NAME???']] > ???Xval' # # # # stderror = (p * (1 p))**0.5 - Step 4: Construct confidence interval for population proport t print ('Confidence Interval Step 4') # n ???DATASET-NAME???[[' ???VARIABLE-NAME???' ]].count() x = (???DATASET-NAME???[[' ???VARIABLE-NAME???']] p = x+1.0 stderror = (p * (1 - p))**0.5 > ??7xvalue tprint (st.norm.interval(0.99, p, stderror)) print (") Step 5: Construct confidence interval for population mean t print ('Confidence Interval Step 5') n-???DATASET_NAME???'???VARIABLE_NAME???']].count() df = n-1 mean = ???DATASET-NAME??? [['???VARIABLE-NAME???' ]].mean() stdev = ???DATASET-NAME??? [['???VARIABLE-NAME???' ]].std() t stderror - stdev/ (n**0.5) print (st.t.interval (0.95, df, mean, stderror)) print (") Step 6: Perform hypothesis test for population proportion print ("Hypothesis Test - Step 61) # ???DATASET-NAME???[[' ???VARIABLE-NAME???' ]].count() n x(?2??DATASET NAME???L'???VARIABLE NAME??? '1] nullvalue ???NULLVALUE??? alternative = '???TESTTYPE???! ???Xvalue - - - # # # # stdev ???DATASET-NAME??? [['???VARIABLE-NAME???' ]].std() stderror = stdev/ (n**0.5) print (st . t . interval (0.95, df, mean, stderror)) print ('') ##Step 6: Perform hypothesis test for population proportion print (Hypothesis Test- Step 6') n = ???DATASET-NAME??? [['???VARIABLE-NAME???' ]].count() x = (???DATASET-NAME???[[' ???VARIABLE-NAME???']] > ??TXvalue nulivalue = ???NULLVALUE??? alternative = '???TEST-TYPE???! print (prop-1samp_ztest(x, n, null-value, alternative)) print ('') # # # # # # # - - ##Step 7: Perform hypothesis test for population mean # print (Hypothesis Test- Step 7') # n = ???DATASET-NAME??? [['???VARIABLE-NAME???' ]].count() #df = n-1 # mean ???DATASET-NAME???[[' ???VARIABLE-NAME???' ]].mean() # std-dev ???DATASET-NAME??? [['???VARIABLE-NAME???' ]].std() # nulivalue = ???NULLVALUE??? # alternative = '???TEST-TYPE???! # print (means-1samp-ttest(mean, std-dev, n, null-value, alter # print ('')
Step by Step Solution
There are 3 Steps involved in it

Get step-by-step solutions from verified subject matter experts