

Question: based on RStudio, please give me your R script that you used to run the models for the questions. In an effort to disentangle spurious
based on RStudio, please give me your R script that you used to run the models for the questions.
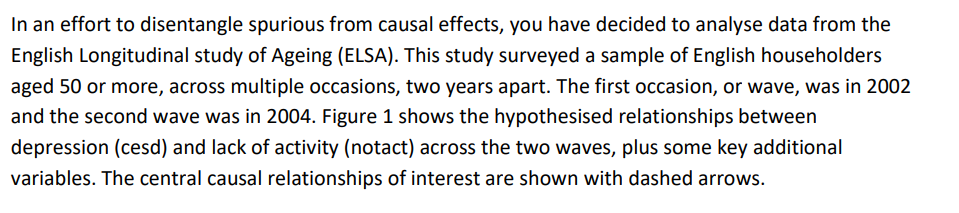
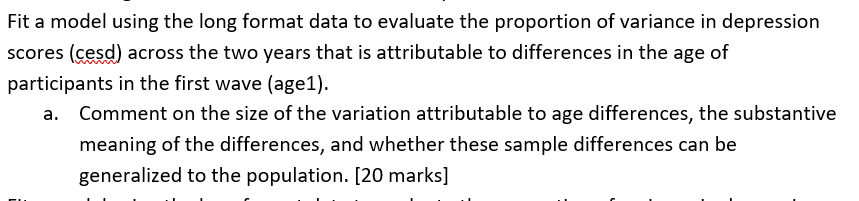
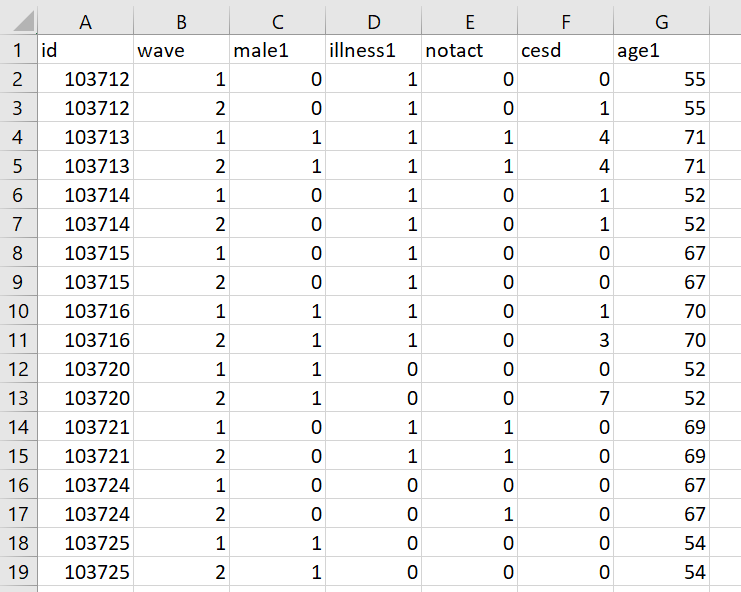
In an effort to disentangle spurious from causal effects, you have decided to analyse data from the English Longitudinal study of Ageing (ELSA). This study surveyed a sample of English householders aged 50 or more, across multiple occasions, two years apart. The first occasion, or wave, was in 2002 and the second wave was in 2004. Figure 1 shows the hypothesised relationships between depression (cesd) and lack of activity (notact) across the two waves, plus some key additional variables. The central causal relationships of interest are shown with dashed arrows. Fit a model using the long format data to evaluate the proportion of variance in depression scores (cesd) across the two years that is attributable to differences in the age of participants in the first wave (age1). Comment on the size of the variation attributable to age differences, the substantive meaning of the differences, and whether these sample differences can be generalized to the population. [20 marks] A B LL G D illness1 E notact F cesd 1 id age1 male1 1 2 2 2 0 0 O 55 1 1 3 2 0 1 55 0 1 4 1 4 1 2 1 1 71 71 1 1 4 5 6 1 0 1 0 1 52 0 1 2 1 2 52 67 0 7 8 9 10 1 wave 103712 103712 103713 103713 103714 103714 103715 103715 103716 103716 103720 103720 103721 103721 103724 103724 103725 103725 0 1 1 1 1 11 1 1 2 1 1 67 70 70 52 52 69 0 0 0 0 o 0 o 0 1 1 0 1 1 0 o 1 3 0 7 0 0 0 0 12 13 14 15 16 N 1 0 1 0 1 2 69 0 0 1 0 1 67 67 17 2 0 0 1 1 0 0 0 54 18 19 N 1 0 0 0 54 In an effort to disentangle spurious from causal effects, you have decided to analyse data from the English Longitudinal study of Ageing (ELSA). This study surveyed a sample of English householders aged 50 or more, across multiple occasions, two years apart. The first occasion, or wave, was in 2002 and the second wave was in 2004. Figure 1 shows the hypothesised relationships between depression (cesd) and lack of activity (notact) across the two waves, plus some key additional variables. The central causal relationships of interest are shown with dashed arrows. Fit a model using the long format data to evaluate the proportion of variance in depression scores (cesd) across the two years that is attributable to differences in the age of participants in the first wave (age1). Comment on the size of the variation attributable to age differences, the substantive meaning of the differences, and whether these sample differences can be generalized to the population. [20 marks] A B LL G D illness1 E notact F cesd 1 id age1 male1 1 2 2 2 0 0 O 55 1 1 3 2 0 1 55 0 1 4 1 4 1 2 1 1 71 71 1 1 4 5 6 1 0 1 0 1 52 0 1 2 1 2 52 67 0 7 8 9 10 1 wave 103712 103712 103713 103713 103714 103714 103715 103715 103716 103716 103720 103720 103721 103721 103724 103724 103725 103725 0 1 1 1 1 11 1 1 2 1 1 67 70 70 52 52 69 0 0 0 0 o 0 o 0 1 1 0 1 1 0 o 1 3 0 7 0 0 0 0 12 13 14 15 16 N 1 0 1 0 1 2 69 0 0 1 0 1 67 67 17 2 0 0 1 1 0 0 0 54 18 19 N 1 0 0 0 54Step by Step Solution
There are 3 Steps involved in it
1 Expert Approved Answer
Step: 1 Unlock

Question Has Been Solved by an Expert!
Get step-by-step solutions from verified subject matter experts
Step: 2 Unlock
Step: 3 Unlock