

Question: Based on standard risk-adjustment techniques, are fund managers doing a good job for clients who allocate all their risky assets to the fund (instead of
Based on standard risk-adjustment techniques, are fund managers doing a good job for clients who allocate all their risky assets to the fund (instead of the Market Portfolio)? And for clients that allocate a very small fraction of their risky assets to the fund (and the rest in the Market Portfolio)?
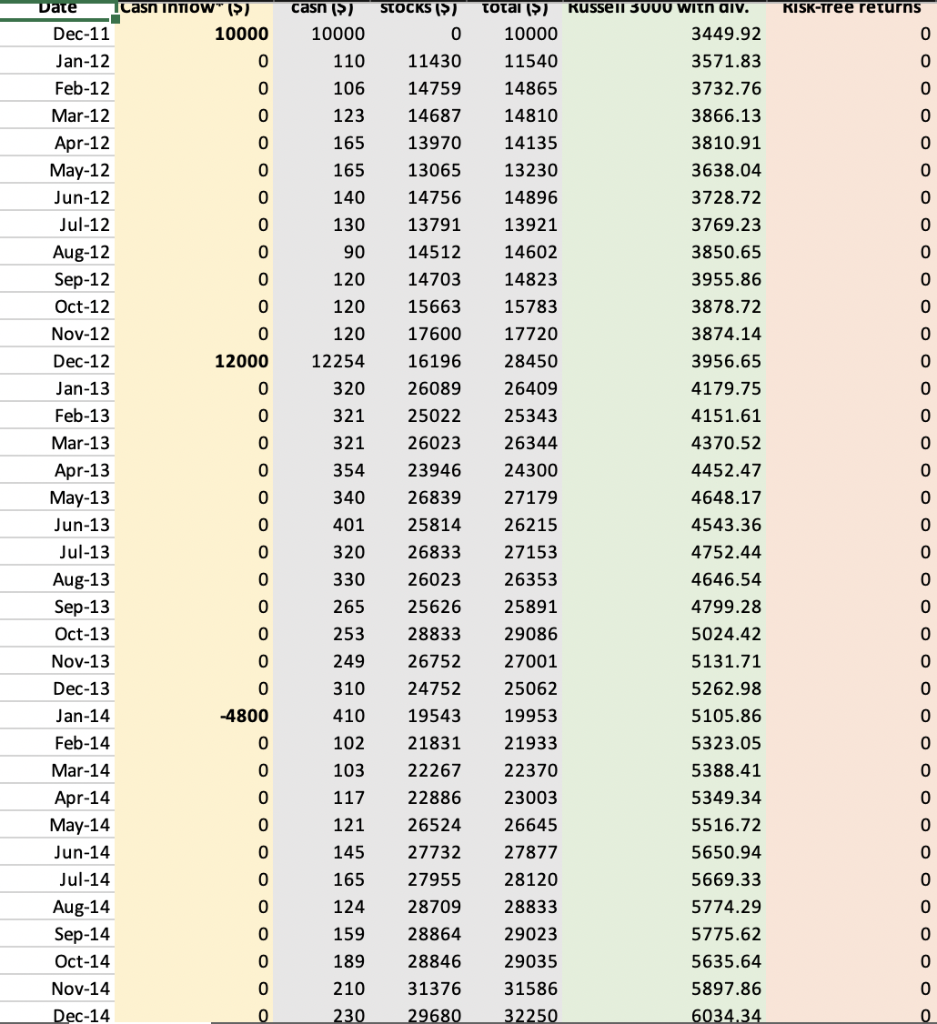
Casn Intiow" () RISK-tree returns 10000 0 casn (>) 10000 110 106 123 165 0 0 0 0 STOCKS (>) 0 11430 14759 14687 13970 13065 14756 13791 14512 14703 15663 17600 16196 0 165 140 130 90 120 120 0 0 0 0 0 12000 0 o o 120 12254 320 321 321 Date Dec-11 Jan-12 Feb-12 Mar-12 Apr-12 May-12 Jun-12 Jul-12 Aug-12 Sep-12 Oct-12 Nov-12 Dec-12 Jan-13 Feb-13 Mar-13 Apr-13 May-13 Jun-13 Jul-13 Aug-13 Sep-13 Oct-13 Nov-13 Dec-13 Jan-14 Feb-14 Mar-14 Apr-14 May-14 Jun-14 Jul-14 Aug-14 Sep-14 Oct-14 Nov-14 Dec-14 total (Y) Russell 3000 with aiv. 10000 3449.92 11540 3571.83 14865 3732.76 14810 3866.13 14135 3810.91 13230 3638.04 14896 3728.72 13921 3769.23 14602 3850.65 14823 3955.86 15783 3878.72 17720 3874.14 28450 3956.65 26409 4179.75 25343 4151.61 26344 4370.52 24300 4452.47 27179 4648.17 26215 4543.36 27153 4752.44 26353 4646.54 25891 4799.28 29086 5024.42 27001 5131.71 25062 5262.98 19953 5105.86 21933 5323.05 22370 5388.41 23003 5349.34 26645 5516.72 27877 5650.94 28120 5669.33 28833 5774.29 29023 5775.62 29035 5635.64 31586 5897.86 32250 6034.34 354 340 401 320 330 265 253 249 310 0 0 0 O oc 26089 25022 26023 23946 26839 25814 26833 26023 25626 28833 26752 24752 19543 21831 22267 22886 26524 27732 27955 28709 28864 28846 31376 29680 0 0 -4800 0 410 102 103 0 0 117 121 0 0 0 0 0 145 165 124 159 189 210 230 0 0 0 Casn Intiow" () RISK-tree returns 10000 0 casn (>) 10000 110 106 123 165 0 0 0 0 STOCKS (>) 0 11430 14759 14687 13970 13065 14756 13791 14512 14703 15663 17600 16196 0 165 140 130 90 120 120 0 0 0 0 0 12000 0 o o 120 12254 320 321 321 Date Dec-11 Jan-12 Feb-12 Mar-12 Apr-12 May-12 Jun-12 Jul-12 Aug-12 Sep-12 Oct-12 Nov-12 Dec-12 Jan-13 Feb-13 Mar-13 Apr-13 May-13 Jun-13 Jul-13 Aug-13 Sep-13 Oct-13 Nov-13 Dec-13 Jan-14 Feb-14 Mar-14 Apr-14 May-14 Jun-14 Jul-14 Aug-14 Sep-14 Oct-14 Nov-14 Dec-14 total (Y) Russell 3000 with aiv. 10000 3449.92 11540 3571.83 14865 3732.76 14810 3866.13 14135 3810.91 13230 3638.04 14896 3728.72 13921 3769.23 14602 3850.65 14823 3955.86 15783 3878.72 17720 3874.14 28450 3956.65 26409 4179.75 25343 4151.61 26344 4370.52 24300 4452.47 27179 4648.17 26215 4543.36 27153 4752.44 26353 4646.54 25891 4799.28 29086 5024.42 27001 5131.71 25062 5262.98 19953 5105.86 21933 5323.05 22370 5388.41 23003 5349.34 26645 5516.72 27877 5650.94 28120 5669.33 28833 5774.29 29023 5775.62 29035 5635.64 31586 5897.86 32250 6034.34 354 340 401 320 330 265 253 249 310 0 0 0 O oc 26089 25022 26023 23946 26839 25814 26833 26023 25626 28833 26752 24752 19543 21831 22267 22886 26524 27732 27955 28709 28864 28846 31376 29680 0 0 -4800 0 410 102 103 0 0 117 121 0 0 0 0 0 145 165 124 159 189 210 230 0 0 0
Step by Step Solution
There are 3 Steps involved in it

Get step-by-step solutions from verified subject matter experts