

Question: Based on state level data, researchers conducted an analysis on the correlates of motor vehicle fatalities (measured as the number of deaths per 100,000 people).
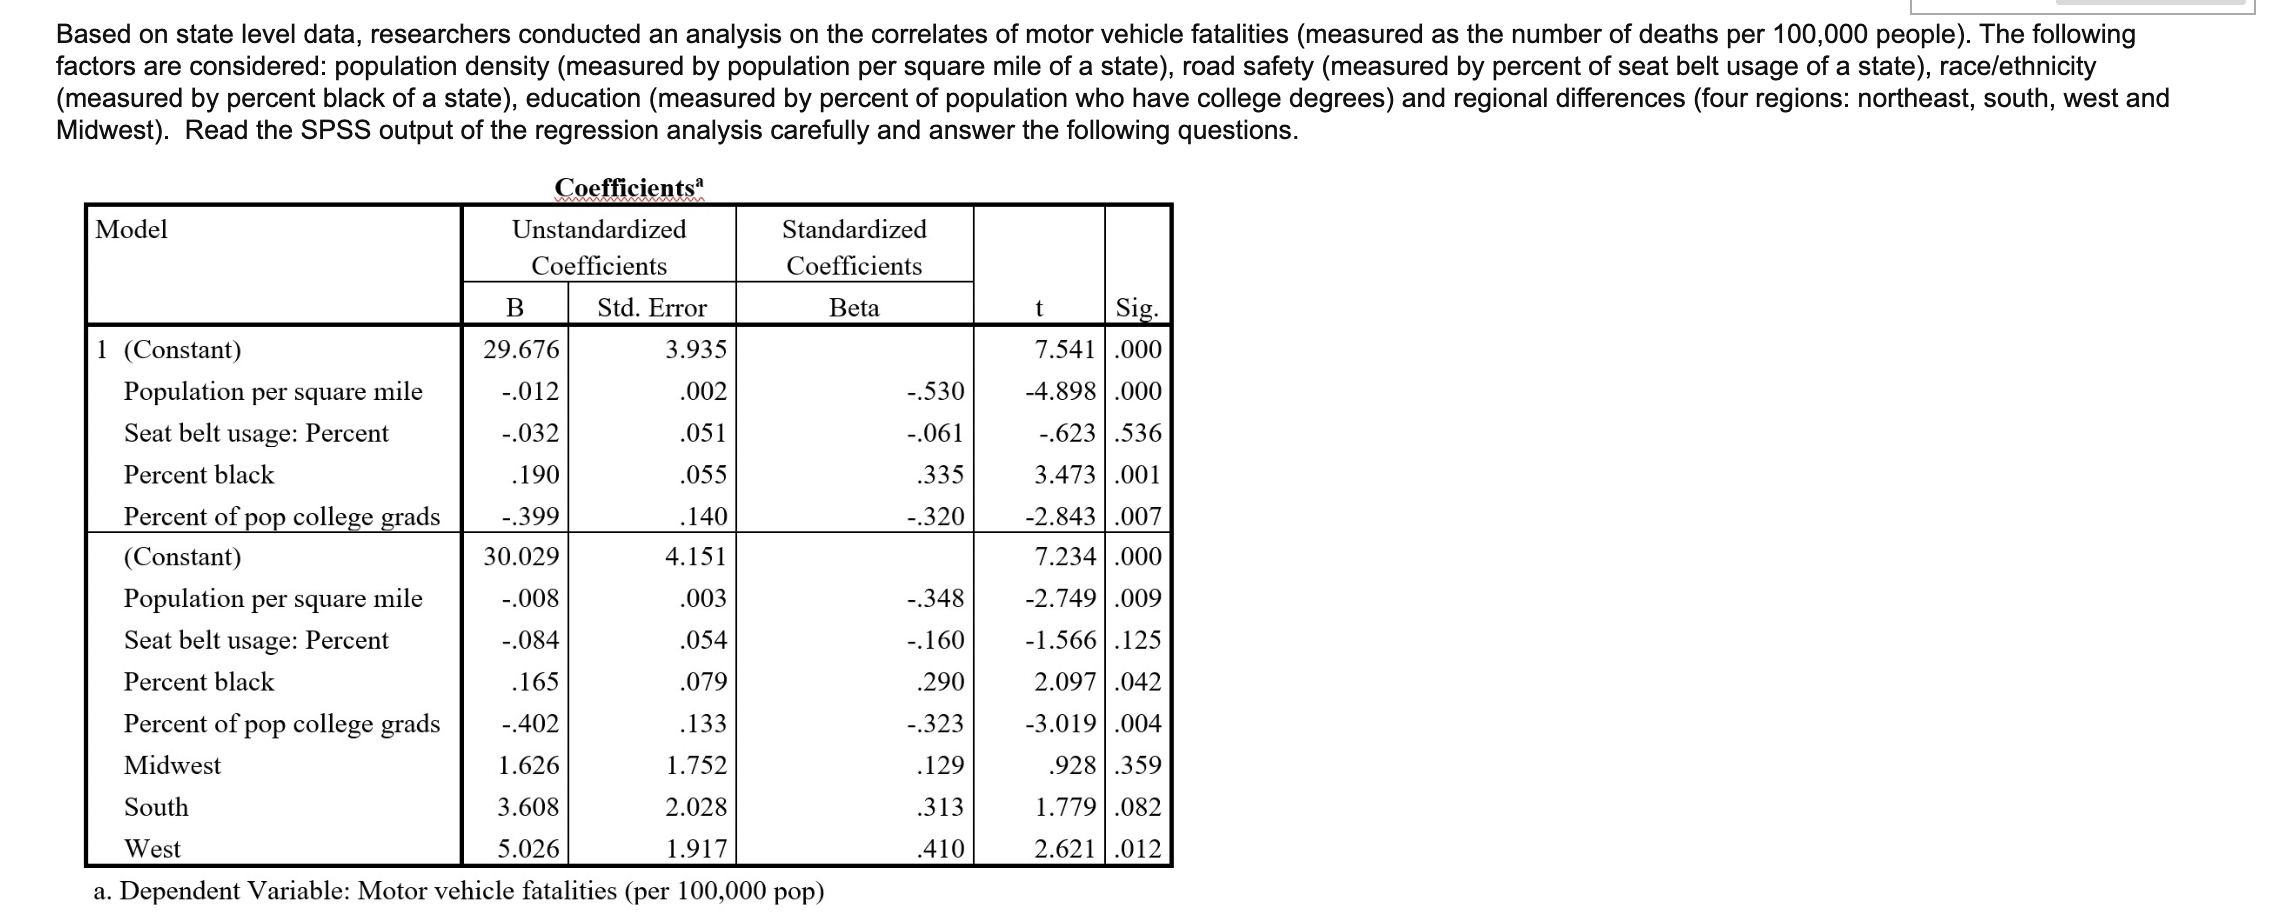
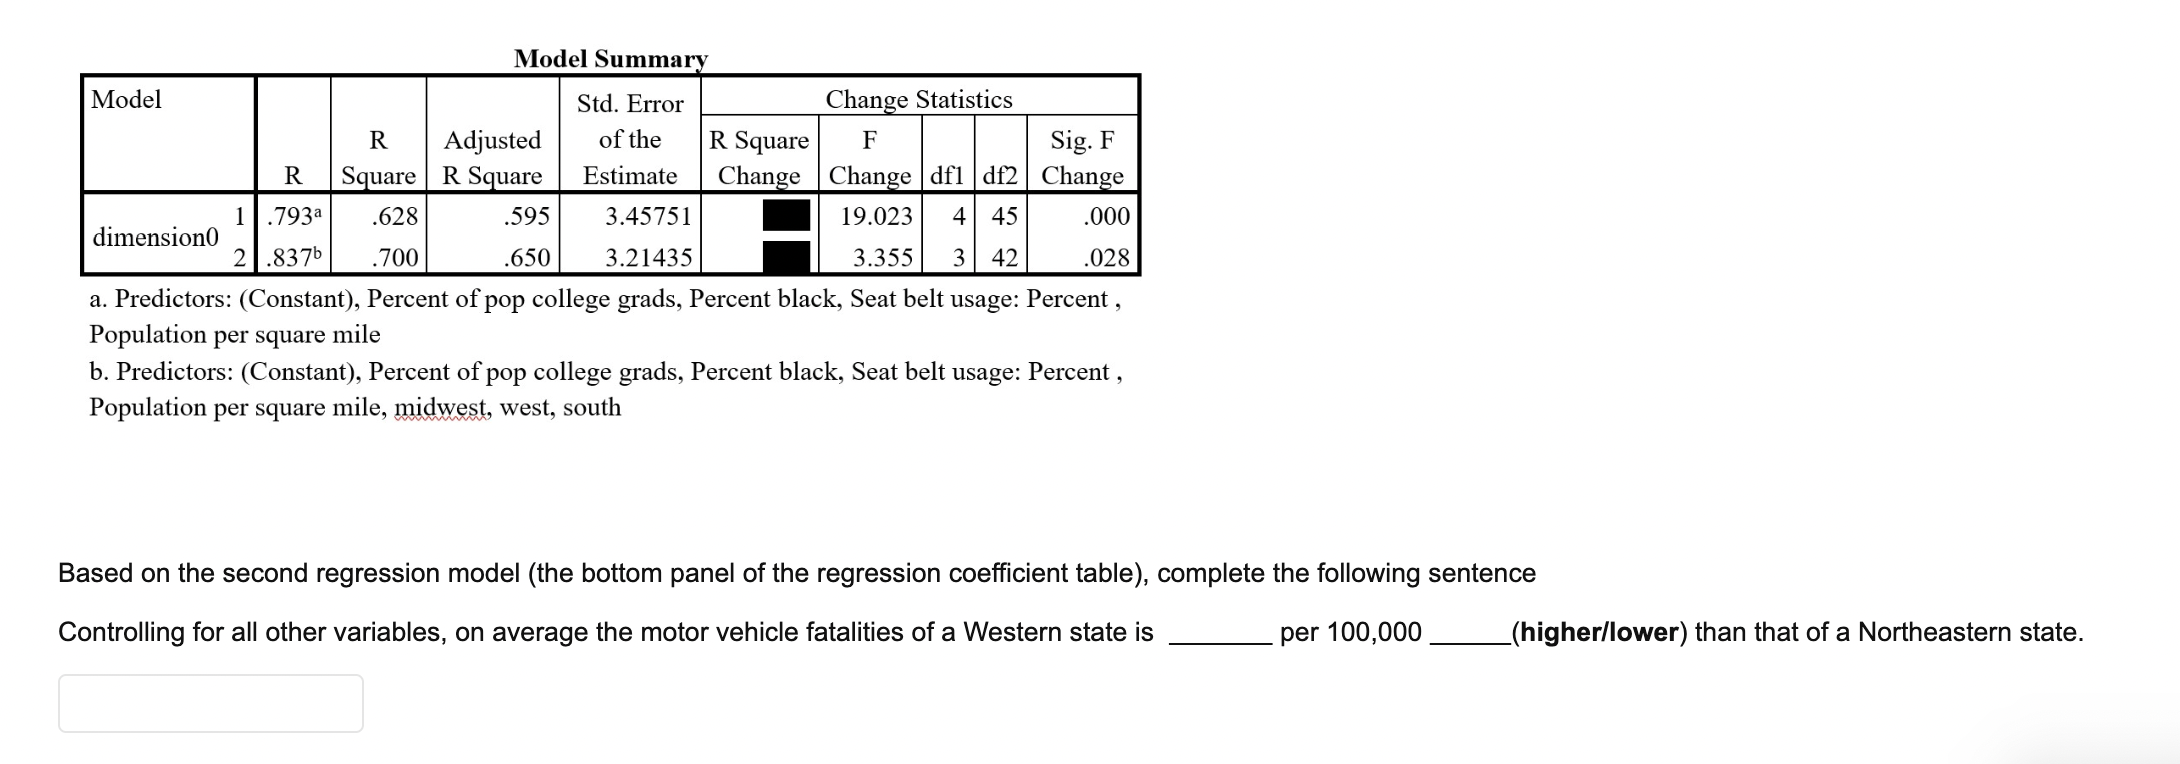


Based on state level data, researchers conducted an analysis on the correlates of motor vehicle fatalities (measured as the number of deaths per 100,000 people). The following factors are considered: population density (measured by population per square mile of a state), road safety (measured by percent of seat belt usage of a state), race/ethnicity (measured by percent black of a state), education (measured by percent of population who have college degrees) and regional differences (four regions: northeast, south, west and Midwest). Read the SPSS output of the regression analysis carefully and answer the following questions. ngigiems'. Unstand ardized Standardized C oefticients Coefficients B Std. Error Beta l (Constant) Population per square mile Seat belt usage: Percent Percent black Percent of pop college grads (Constant) Population per square mile Seat belt usage: Percent Percent black Percent of pop college grads Midwest South West at Dependent Variable: Motor vehicle fatalities (per 100,000 pop) Model Summary Model Std. Error Change Statistics R Adjusted of the R Square F Sig. F R Square R Square Estimate Change Change df1 df2 Change .793 628 595 3.45751 19.023 45 000 dimension0 2 837b 700 650 3.21435 3.355 3 42 028 a. Predictors: (Constant), Percent of pop college grads, Percent black, Seat belt usage: Percent , Population per square mile b. Predictors: (Constant), Percent of pop college grads, Percent black, Seat belt usage: Percent , Population per square mile, midwest, west, south Based on the second regression model (the bottom panel of the regression coefficient table), complete the following sentence Controlling for all other variables, on average the motor vehicle fatalities of a Western state is per 100,000 (higher/lower) than that of a Northeastern state
Step by Step Solution
There are 3 Steps involved in it

Get step-by-step solutions from verified subject matter experts