

Question: Based on the 2 Audit Plans attached, make a plan for sampling and testing controls. This can be done in a table format in your
Based on the 2 Audit Plans attached, make a plan for sampling and testing controls.
This can be done in a table format in your Excel workbook of audit papers. Include the account or process (i.e. Accounts Receivable or Cash Handling), objective, method, exception criteria, population, sampling unit and tolerable exception rate. For Sampling units, where exact numbers are not known (such as total number of customer accounts within Accounts Receivable), use an appropriate portion such as 1 out of 1,000.
In your spreadsheet, be sure to include your reasons for the criteria you chose.
Submit the Sampling and Testing Plan of Controls for grading purposes. The Sampling and Testing Plan of Controls should be part of your Excel working papers so you can turn in the entire workbook. Please be sure the tabs in the workbook are labeled appropriately.
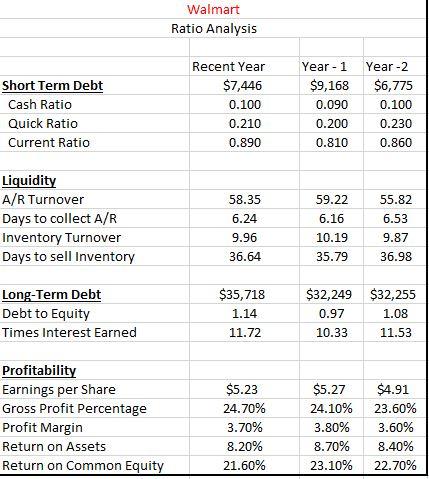
Walmart Ratio Analysis \begin{tabular}{l|c|c|c|} \hline & Recent Year & Year -1 & Year -2 \\ \hline Short Term Debt & $7,446 & $9,168 & $6,775 \\ \hline Cash Ratio & 0.100 & 0.090 & 0.100 \\ \hline Quick Ratio & 0.210 & 0.200 & 0.230 \\ \hline Current Ratio & 0.890 & 0.810 & 0.860 \\ \hline & & & \\ \hline Liquidity & & & \\ \hline A/R Turnover & 58.35 & 59.22 & 55.82 \\ \hline Days to collect A/R & 6.24 & 6.16 & 6.53 \\ \hline Inventory Turnover & 9.96 & 10.19 & 9.87 \\ \hline Days to sell Inventory & 36.64 & 35.79 & 36.98 \\ \hline & & & \\ \hline Long-Term Debt & $35,718 & $32,249 & $32,255 \\ \hline Debt to Equity & 1.14 & 0.97 & 1.08 \\ \hline Times Interest Earned & 11.72 & 10.33 & 11.53 \\ \hline Profitability & & & \\ \hline Earnings per Share & & & \\ \hline Gross Profit Percentage & $4.23 & $5.27 & $4.91 \\ \hline Profit Margin & 3.70% & 24.10% & 23.60% \\ \hline Return on Assets & 8.20% & 8.70% & 3.60% \\ \hline Return on Common Equity & 21.60% & 23.10% & 22.70% \\ \hline \end{tabular} Walmart Ratio Analysis \begin{tabular}{l|c|c|c|} \hline & Recent Year & Year -1 & Year -2 \\ \hline Short Term Debt & $7,446 & $9,168 & $6,775 \\ \hline Cash Ratio & 0.100 & 0.090 & 0.100 \\ \hline Quick Ratio & 0.210 & 0.200 & 0.230 \\ \hline Current Ratio & 0.890 & 0.810 & 0.860 \\ \hline & & & \\ \hline Liquidity & & & \\ \hline A/R Turnover & 58.35 & 59.22 & 55.82 \\ \hline Days to collect A/R & 6.24 & 6.16 & 6.53 \\ \hline Inventory Turnover & 9.96 & 10.19 & 9.87 \\ \hline Days to sell Inventory & 36.64 & 35.79 & 36.98 \\ \hline & & & \\ \hline Long-Term Debt & $35,718 & $32,249 & $32,255 \\ \hline Debt to Equity & 1.14 & 0.97 & 1.08 \\ \hline Times Interest Earned & 11.72 & 10.33 & 11.53 \\ \hline Profitability & & & \\ \hline Earnings per Share & & & \\ \hline Gross Profit Percentage & $4.23 & $5.27 & $4.91 \\ \hline Profit Margin & 3.70% & 24.10% & 23.60% \\ \hline Return on Assets & 8.20% & 8.70% & 3.60% \\ \hline Return on Common Equity & 21.60% & 23.10% & 22.70% \\ \hline \end{tabular}
Step by Step Solution
There are 3 Steps involved in it

Get step-by-step solutions from verified subject matter experts