

Question: Based on the below graph, can the Malthusian growth model explain the evolution of population and income per capita in the world up to 1750?
Based on the below graph, can the Malthusian growth model explain the evolution of population and income per capita in the world up to 1750? Explain
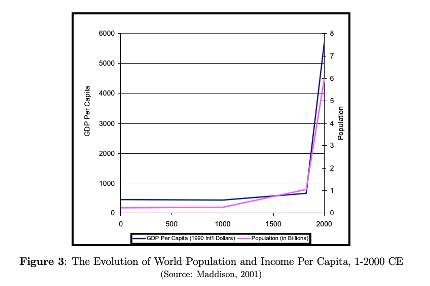
GDP Per Capits 6000 5000 4000 3000 2000 1000 500 1000 1500 GDP Par Capn (1880 het Doen) - Popubkon (n Bli Bana 7 5 M 2 0 2000 Population Figure 3: The Evolution of World Population and Income Per Capita, 1-2000 CE (Source: Maddison, 2001)
Step by Step Solution
There are 3 Steps involved in it
1 Expert Approved Answer
Step: 1 Unlock

The graph represents the evolution of world population and income per capita from 1 CE to 2000 CE ba... View full answer
Question Has Been Solved by an Expert!
Get step-by-step solutions from verified subject matter experts
Step: 2 Unlock
Step: 3 Unlock