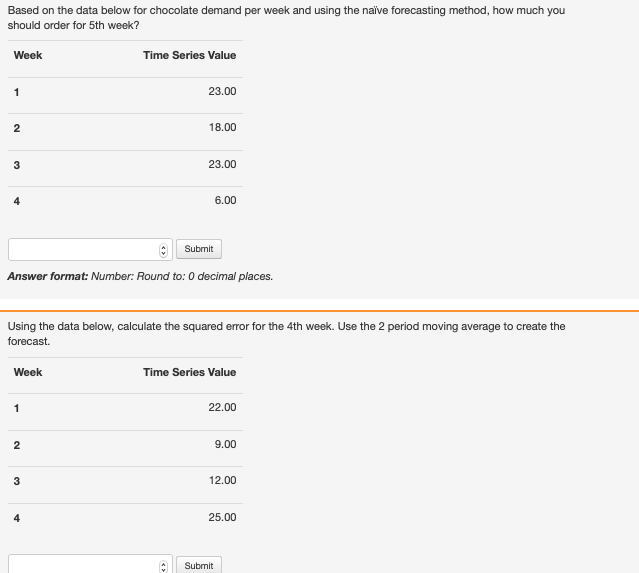
Question: Based on the data below for chocolate demand per week and using the naive forecasting method, how much you should order for 5th week? Week

Based on the data below for chocolate demand per

Based on the data below for chocolate demand per

Based on the data below for chocolate demand per week and using the naive forecasting method, how much you should order for 5th week? Week Time Series Value 1 23.00 2 18.00 3 23.00 4 6.00 Submit Answer format: Number: Round to: O decimal places. Using the data below, calculate the squared error for the 4th week. Use the 2 period moving average to create the forecast. Week Time Series Value 1 22.00 2 9.00 3 12.00 4 25.00 Submit Using the data below, calculate the bias based on using the naive forecast method. Week Time Series Value 1 18.00 2 16.00 3 16.00 4 7.00 Submit Answer format: Number: Round to: 1 decimal places. Using the data below, what is the weighted moving average forecast for the 4th week? The weights are 20.30,.50 (oldest period to most recent period) Week Time Series Value 1 5.00 2 11.00 3 23.00 4 23.00 Submit

Step by Step Solution

There are 3 Steps involved in it

1 Expert Approved Answer
Step: 1 Unlock blur-text-image
Question Has Been Solved by an Expert!

Get step-by-step solutions from verified subject matter experts

Step: 2 Unlock
Step: 3 Unlock

Students Have Also Explored These Related General Management Questions!