

Question: Based on the data, how would you summarize the company performance for last 3 years, how do they compare to its competitor Pepsi, and to
Based on the data, how would you summarize the company performance for last 3 years, how do they compare to its competitor Pepsi, and to the industry.
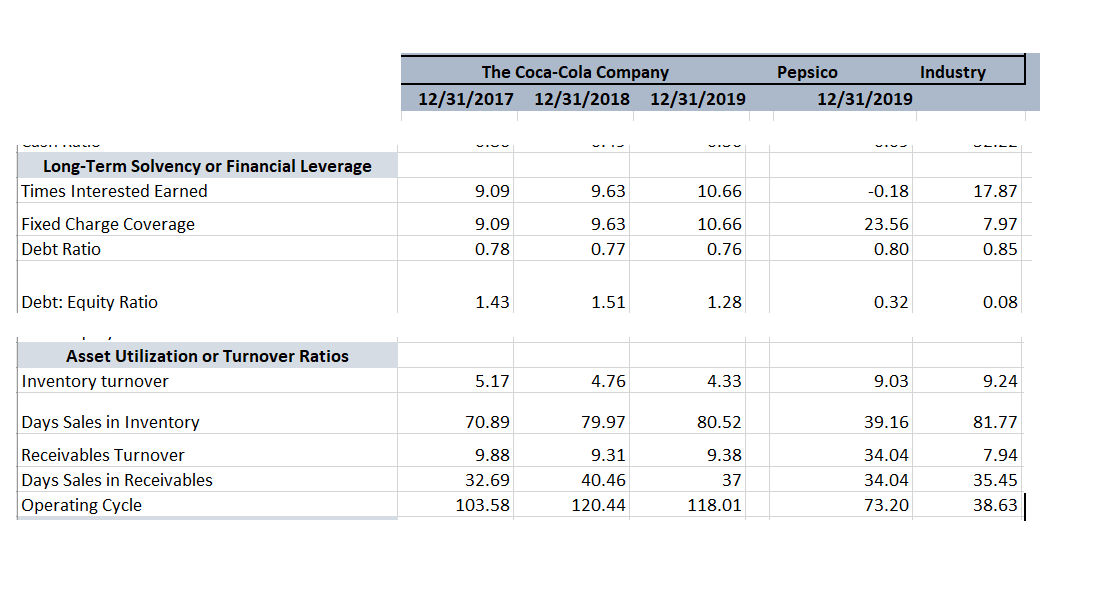
The Coca-Cola Company 12/31/2017 12/31/2018 12/31/2019 Pepsico Industry 12/31/2019 9.09 9.63 10.66 -0.18 17.87 Long-Term Solvency or Financial Leverage Times Interested Earned Fixed Charge Coverage Debt Ratio 9.09 0.78 9.63 0.77 10.66 0.76 23.56 0.80 7.97 0.85 Debt: Equity Ratio 1.43 1.51 1.28 0.32 0.08 Asset Utilization or Turnover Ratios Inventory turnover 5.17 4.76 4.33 9.03 9.24 70.89 79.97 80.52 39.16 81.77 Days Sales in Inventory Receivables Turnover Days Sales in Receivables Operating Cycle 9.88 32.69 103.58 9.31 40.46 120.44 9.38 37 118.01 34.04 34.04 73.20 7.94 35.45 38.63
Step by Step Solution
There are 3 Steps involved in it

Get step-by-step solutions from verified subject matter experts