

Question: Based on the data in Figure 12.10 and assuming that security returns are distributed normally, what is the probability that, in a given year, small-company
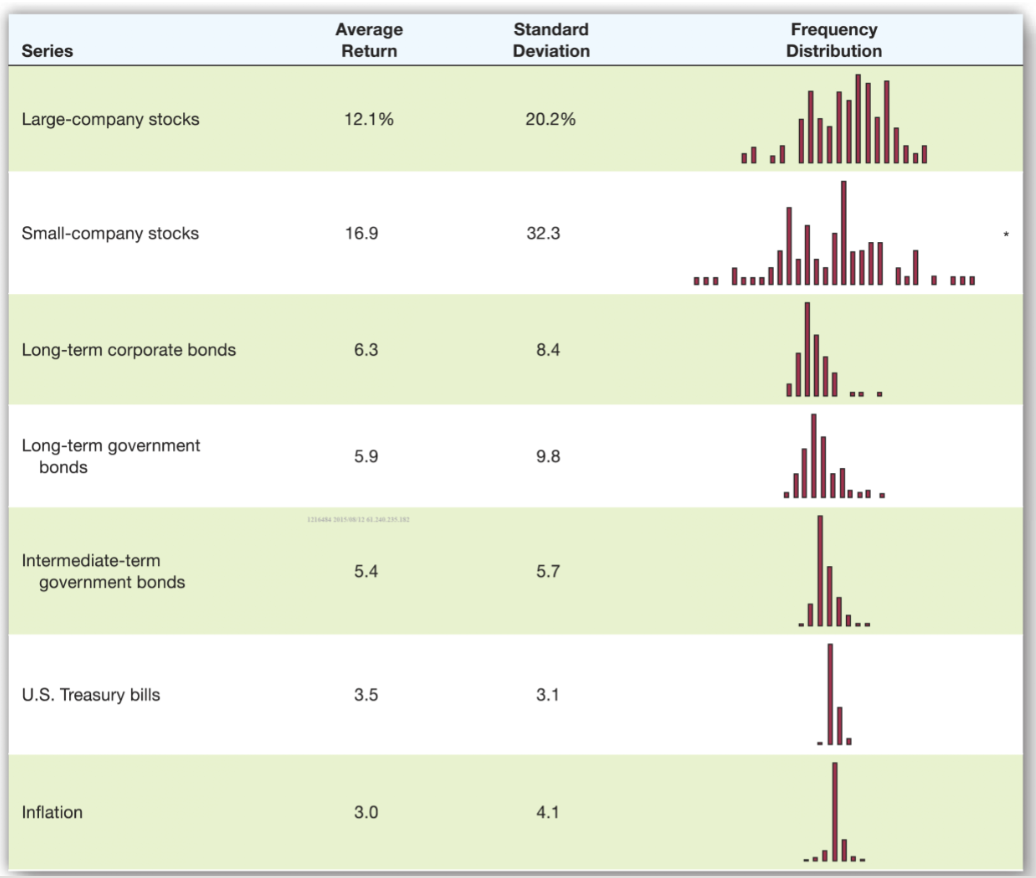 Based on the data in Figure 12.10 and assuming that security returns are distributed normally, what is the probability that, in a given year, small-company stocks will have a return greater than the historical average return for large-company stocks?
- A. 0.735
- B. 0.654
- C. 0.379
- D. 0.425
- E. 0.876
Average Return Standard Deviation Frequency Distribution Series Large-company stocks 12.1% 20.2% | Small-company stocks 16.9 32.3 hom. Long-term corporate bonds 6.3 8.4 Long-term government bonds 5.9 9.8 . Intermediate-term government bonds 5.4 5.7 U.S. Treasury bills 3.5 3.1 II. Inflation 3.0 4.1 .... Average Return Standard Deviation Frequency Distribution Series Large-company stocks 12.1% 20.2% | Small-company stocks 16.9 32.3 hom. Long-term corporate bonds 6.3 8.4 Long-term government bonds 5.9 9.8 . Intermediate-term government bonds 5.4 5.7 U.S. Treasury bills 3.5 3.1 II. Inflation 3.0 4.1
Step by Step Solution
There are 3 Steps involved in it

Get step-by-step solutions from verified subject matter experts