

Question: Based on the example in the slide and the mpl _ squares.py code provided to develop an application that supports the relationship of y =
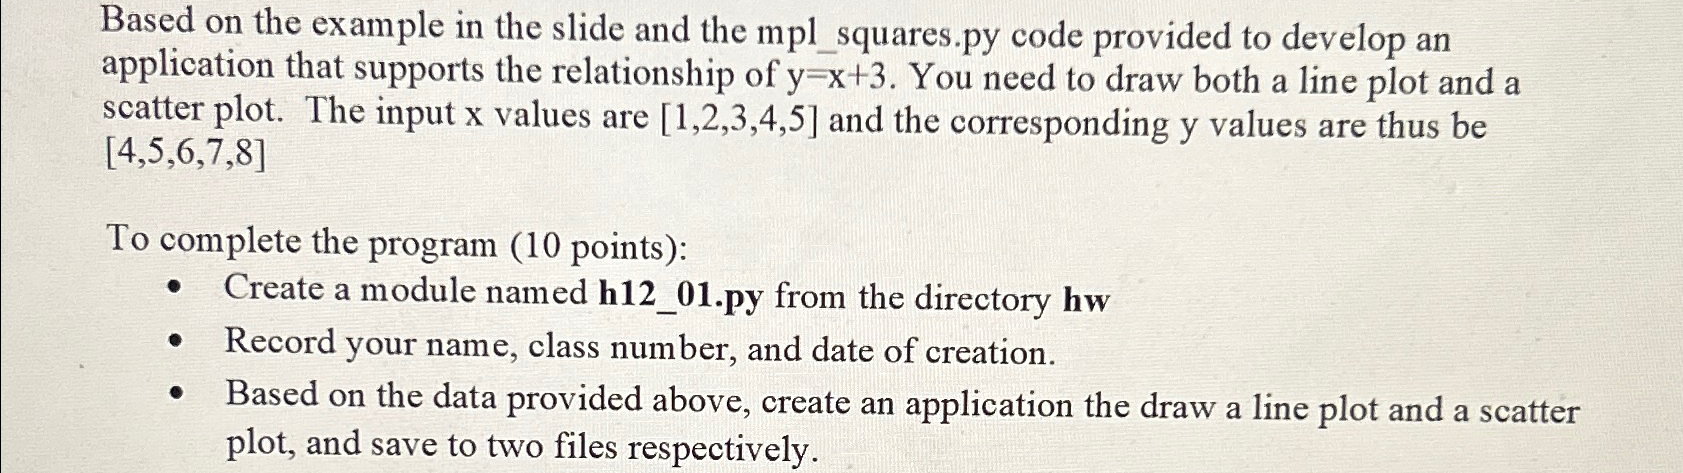
Based on the example in the slide and the mplsquares.py code provided to develop an application that supports the relationship of You need to draw both a line plot and a scatter plot. The input values are and the corresponding values are thus be
To complete the program points:
Create a module named hpy from the directory hw
Record your name, class number, and date of creation.
Based on the data provided above, create an application the draw a line plot and a scatter plot, and save to two files respectively.
Step by Step Solution
There are 3 Steps involved in it
1 Expert Approved Answer
Step: 1 Unlock

Question Has Been Solved by an Expert!
Get step-by-step solutions from verified subject matter experts
Step: 2 Unlock
Step: 3 Unlock